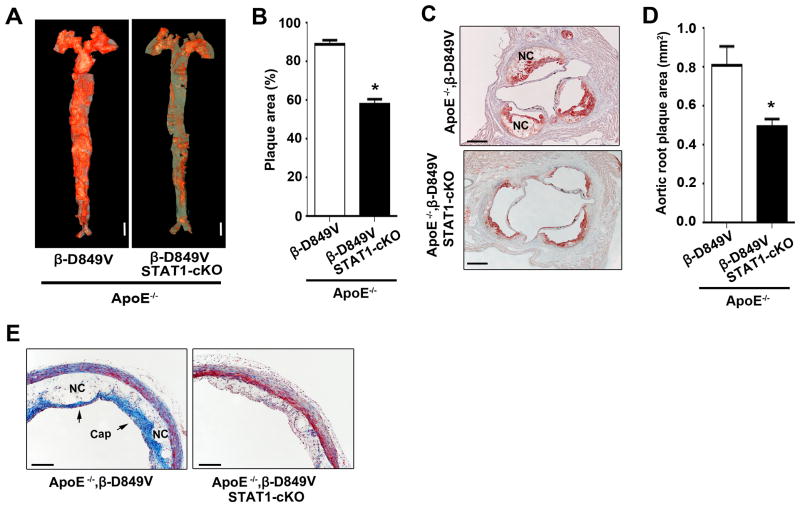
Figure 9. PDGF/STAT1-regulated inflammation amplifies atherosclerosis.
(a) Distribution of atherosclerotic plaques on the aortic lumen of ApoE,PDGFRβSm22D849V mutants and ApoE,STAT1Sm22CKOPDGFRβSm22D849V double mutants after 12 weeks of WD was determined by en face Oil red O staining. Representative pictures of six aortas of each genotype are shown. Scale bar, 5mm. (b) Quantification of plaque area as a percentage of total surface area of the aorta, n=6 aortas per genotype. (c) Distribution of plaques in the aortic root after 12 weeks of WD was determined by staining sections with Oil red O. Representative pictures of six roots of each genotype are shown. NC = necrotic core. Scale bar, 500μm. (d) Quantification of plaque cross-sectional area in the aortic root, n=6 roots per genotype. (e) Histological analysis of plaque morphology in the thoracic aorta after 12 weeks of WD was determined by trichrome staining. Scale bar, 250μm. Representative pictures of three aortas of each genotype are shown. All data represent mean ± s.e.m. *P<0.01 by Student’s t-test.

