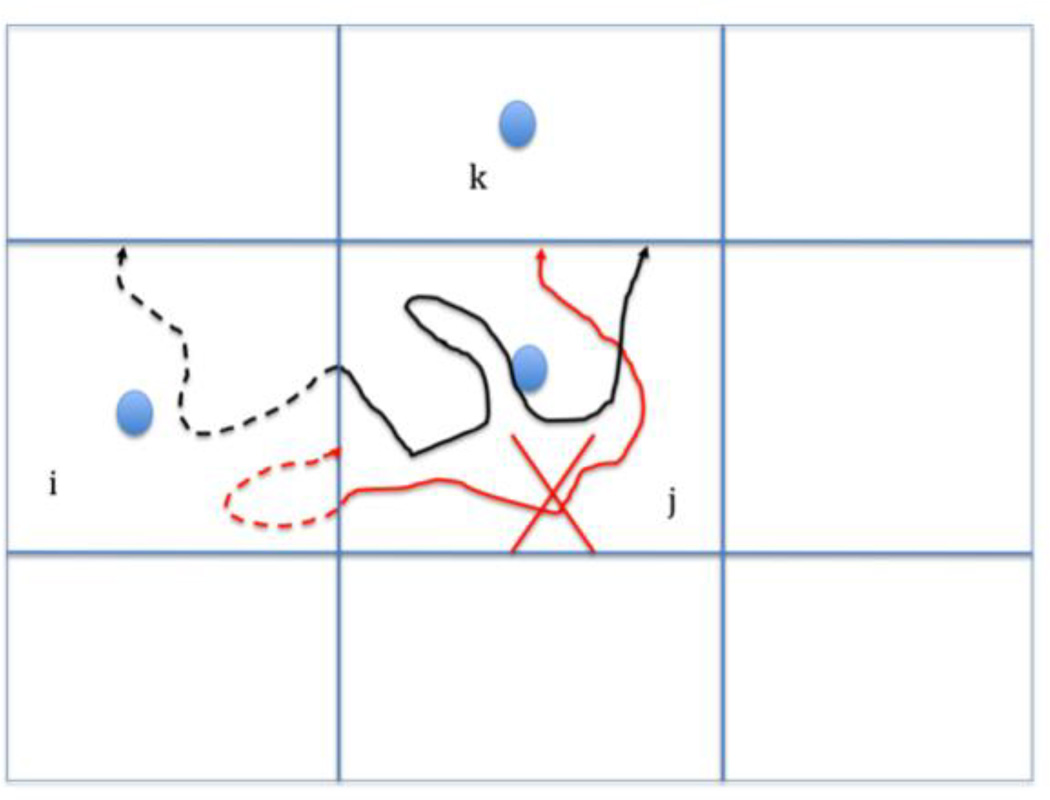
Figure 1.
A schematic representation of the Milestoning algorithm. The blue filled circles denote anchors and the straight blue lines represent the milestones (interfaces) separating the different anchor domains. In Milestoning we estimate the probability that a trajectory initiated at a milestone ij will hit for the first time another milestone jk at time t. We estimate this probability by running a large number of trajectories from ij and record the number of and times of trajectories that hit milestone jk for the first time. The black and red curves are trajectories initiated at milestone ij and terminated at milestone jk. The dashed lines denote time-backward trajectories and are used to check if the initial phase space points are sampled from a first hitting distribution. The black trajectory is acceptable (the backward trajectory reached a different milestone before hitting again the initial milestone) while the red trajectory is not (it returns to the initiating milestone, before hitting another milestone). See Method and reference [37] for more details.

