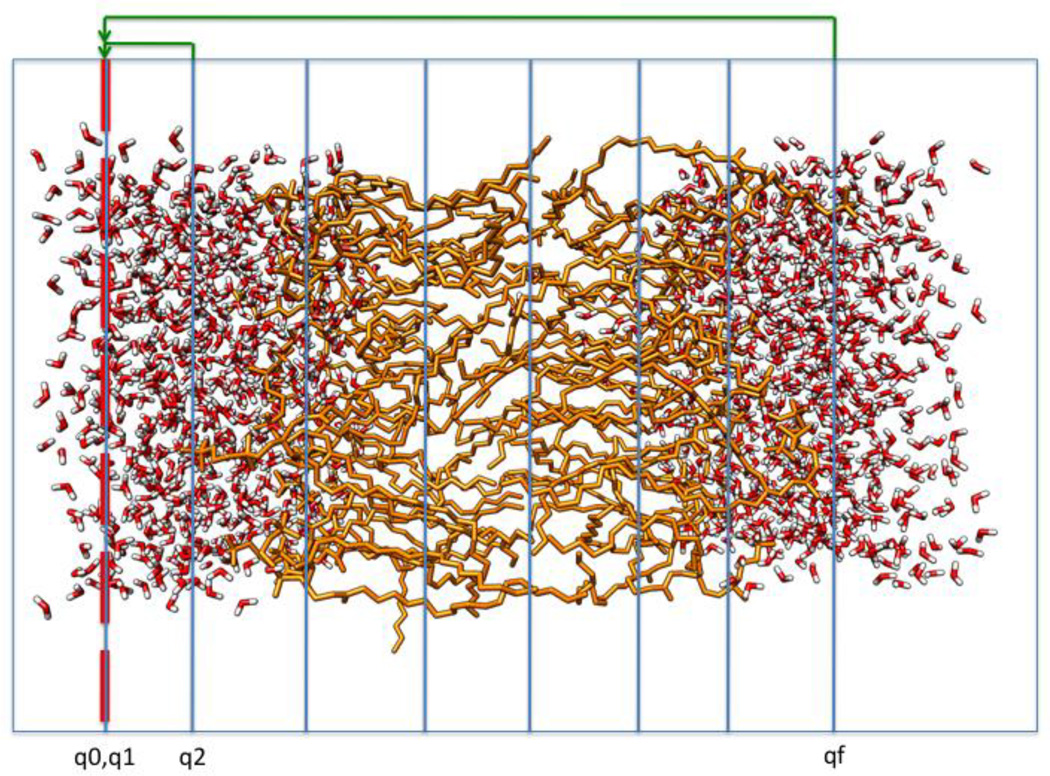
Figure 2.
A schematic representation of the system used to compute the permeation coefficient. We used one-dimensional set up of milestones denoted by blue lines in the figure. We also used cyclic boundary conditions in which trajectories that reach the last milestone qf are returned to the first milestone q1 with probability one. Trajectories that return from milestone q2 to milestone q0 are also returned with probability one to q1. See text for more details.

