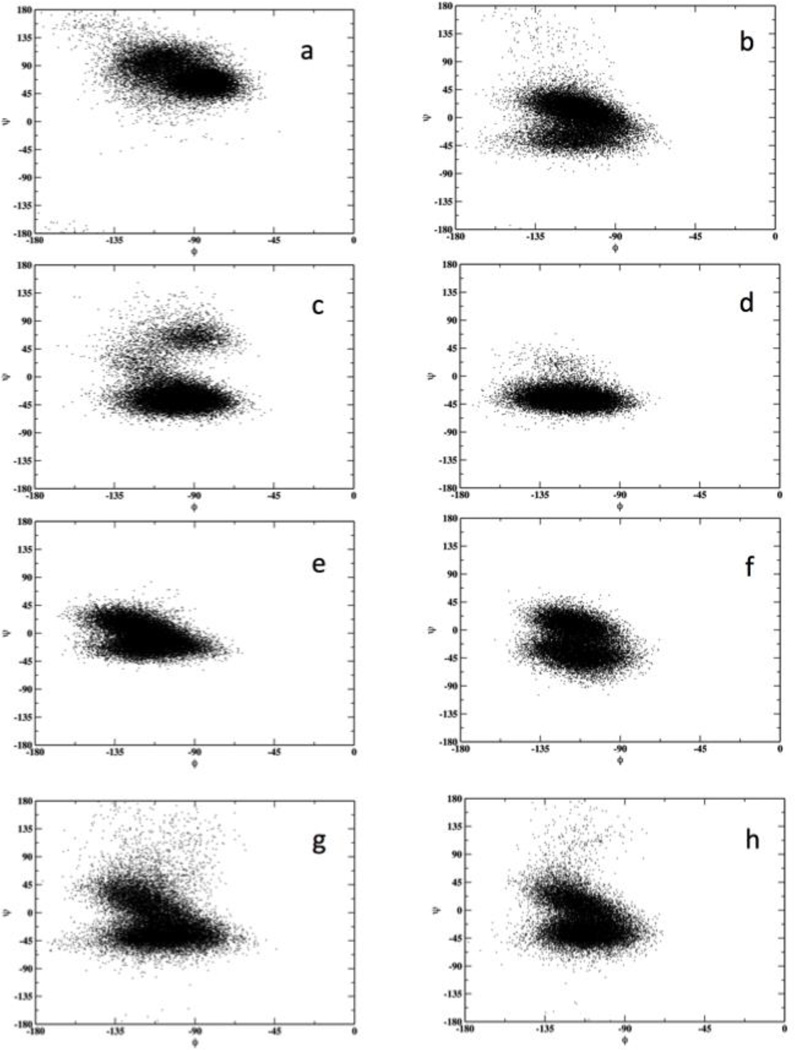
Figure 7.
Sampling of the backbone dihedral angles (φψ) of NATA for different locations along the Z axis. The left side panels correspond to the layer with negative values of Z and the right side to positive values. (a) and (b) |Z| = 0 Å, (c) and (d) |Z| = 4 Å, (e) and (f) |Z| = 15 Å, (g) and (h) |Z| = 30 Å. Positive Z values correspond to slower permeation.

