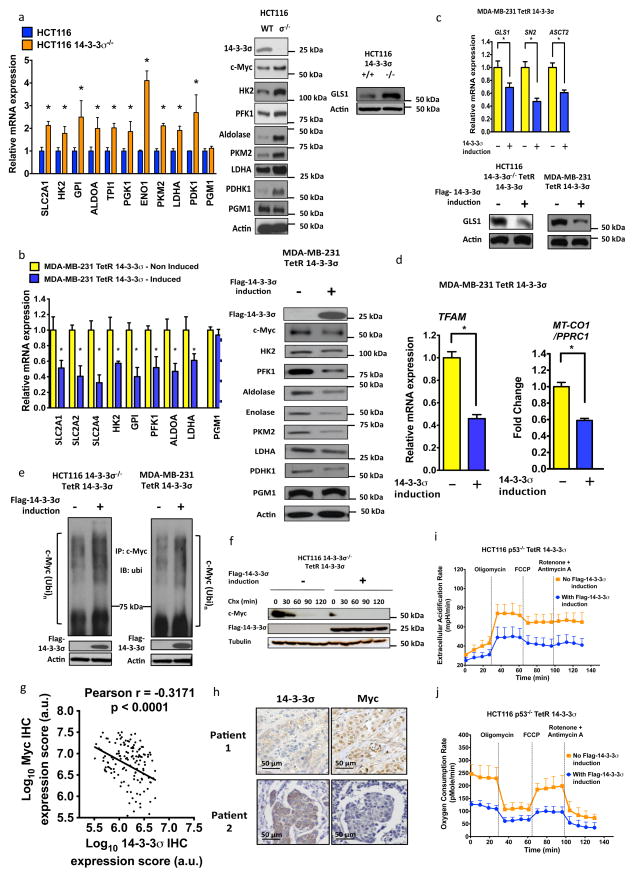
Figure 5. 14-3-3σ inhibits cancer metabolism by promoting Myc degradation.
(a) Loss of 14-3-3σ upregulated Myc-induced glycolytic genes. The expression of glycolytic genes in HCT116 WT (14-3-3σ+/+) and HCT116 14-3-3σ−/− cells were measured using Realtime PCR (left panel). Average±95%CI, n=4, ANOVA,* P< 0.05. Western Blot was performed using the indicated antibodies (right panel).
(b) 14-3-3σ downregulated Myc-induced glycolytic genes. The mRNA expression of glycolytic genes were compared between indicated cells using Realtime PCR (left panel). Average±95%CI, n=3, ANOVA,* P< 0.05. Western Blot was performed using the indicated antibodies (right panel).
(c) 14-3-3σ reduced expression of Myc-induced glutaminolytic genes. Realtime PCR and Western Blot were used to compare the expression of Myc-induced glutaminolytic genes at mRNA and protein levels. Average±95%CI, n=3, ANOVA,* P< 0.05.
(d) 14-3-3σ suppressed TFAM expression and reduced MT-CO1/PPRC1 ratio in vitro. TFAM is an important Myc-induced mitochondrial transcription factor. MT-CO1 is a mitochondrial gene encoding cytochrome c oxidase. PPRC1, peroxisome proliferator-activated receptor gamma, coactivator-related 1, is a gene of nuclear DNA. Average±95% CI, n=3, Student t-test, * p < 0.05.
(e) 14-3-3σ increased Myc ubiquitination. Indicated cells were treated with Doxycycline to induce Flag-14-3-3σ expression (+). Non-induced cells were used as a control (−). Cell lysates were immunoprecipitated with anti-Myc antibodies and immunoblotted with anti-ubiquitin antibodies.
(f) 14-3-3σ shortened Myc half-life. Flag-14-3-3σ was induced by doxycycline in indicated cells. Cells were treated with 200 μg/ml Cycloheximide (Chx) for the indicated times. Cell lysates are immunoblotted with indicated antibodies.
(g) 14-3-3σ expression was inversely correlated with Myc level in 145 patients’ breast tumours. 14-3-3σ and Myc protein expression were quantified from immunohistochemistry (IHC) staining of breast cancer patients tissue microarrays collected at MDACC. Correlation analysis and graph was built using GraphPad Prism software.
(h) Representative immunohistochemistry images of (g) showing the negative correlation between 14-3-3σ and Myc protein expression in breast cancer.
(i) 14-3-3σ diminished the extracellular acidification rates (ECARs) of HCT116 p53−/− in vitro. ECARs were measured by XF96. Average±SD, n=4, p<0.05.
(j) 14-3-3σ diminished the oxygen consumption rates (OCRs) of the p53-deficient colon cancer cell line HCT116 p53−/− in vitro. OCRs were measured by XF96. Average±SD, n=4, p<0.05.

