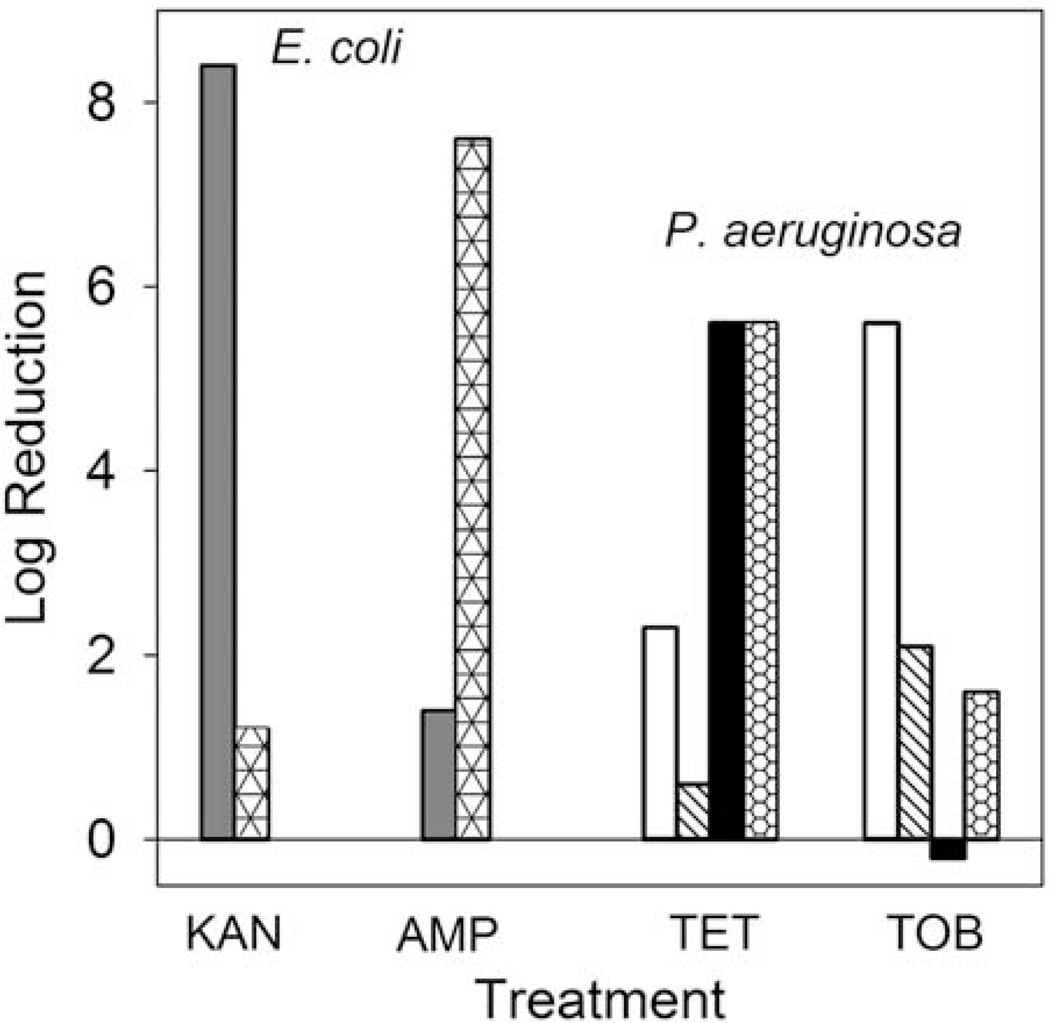
FIGURE 9.
Medium effects on biofilm susceptibility to antibiotics. The different bar fills denote various media: LB (gray); LB + glucose (triangles); TSA, aerobic (white); TSA, anaerobic (hatched); noble agar, aerobic (black); noble agar, anaerobic (honeycomb). Sources: reference 52 for E. coli and unpublished data of Borriello and Stewart for P. aeruginosa. doi:10.1128/microbiolspec.MB-0010-2014.f9

