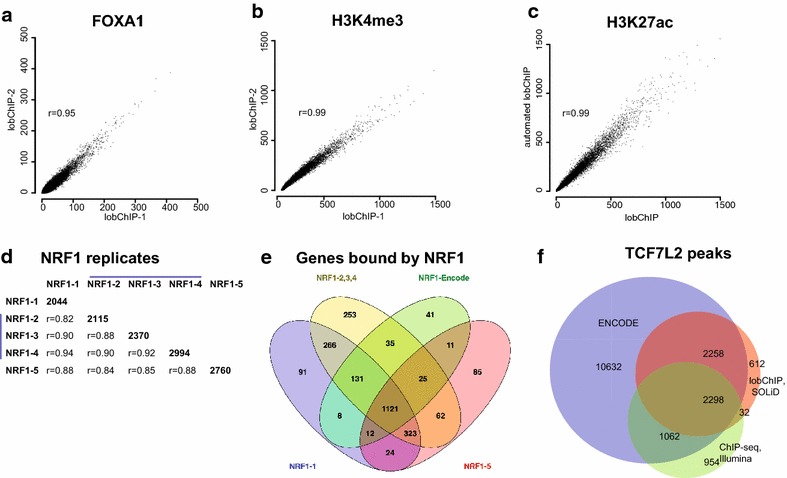
Figure 4.

Relplicate analysis. a FOXA2 read counts at peak locations for two technical replicates. b Scatter plot comparing reads at TSS for two lobChIP technical replicates for H3K4me3. c H3K27ac results for automated and manual lobChIP at TSS. Read counts on x- and y-axis are normalized to sequencing depth. d Five replicates for NRF1, with replicate 2–4 (blue bar) from the same chromatin preparation. The number of peaks is given on the diagonal with correlation coefficients for enrichment below. e Four-way venn diagram for genes with NRF1 peaks, with merged results for the three NRF1 samples made from the same chromatin. f Overlap of TCF7L2 peaks identified in ENCODE, SOLiD lobChIP and standard Illumina ChIP-seq.
