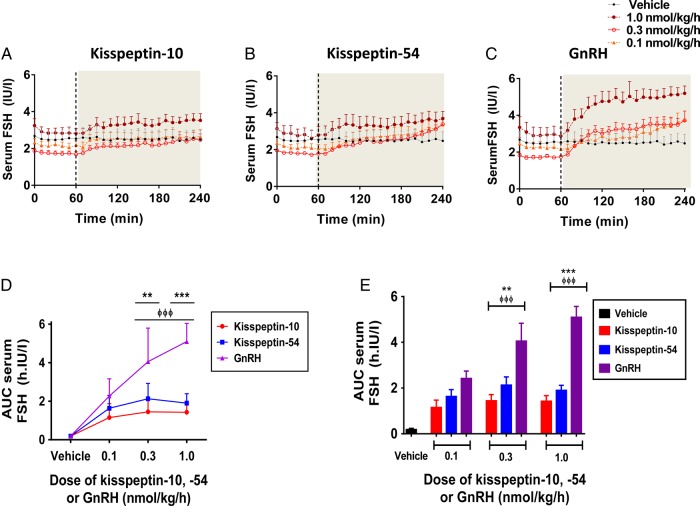
Figure 4.
Change in serum FSH levels during intravenous administration of kisspeptin-10, kisspeptin-54 and GnRH to healthy men. Time profiles of mean change in serum FSH are presented during infusion of vehicle, kisspeptin-10 (A), kisspeptin-54 (B) and GnRH (C), at the following doses: 0.1, 0.3 and 1.0 nmol/kg/h. The infusion period commenced at 60 min and is represented by the grey shaded area. Grey filled circles, vehicle; orange filled triangles, 0.1 nmol/kg/h; red clear circles, 0.3 nmol/kg/h; maroon filled circles, 1.0 nmol/kg/h. Mean change in AUC serum FSH is presented for each infusion group: graph D shows data as linear curves and graph E as bar graphs. Vehicle in black; kisspeptin-10 in red; kisspeptin-54 in blue; GnRH in purple. Data are presented as the mean ± SEM. N = 5/group. **P < 0.01 for GnRH versus kisspeptin-54. ***P < 0.001 for GnRH versus kisspeptin-54. ΦΦΦP < 0.001 for GnRH versus kisspeptin-10.

