
FIG 3.
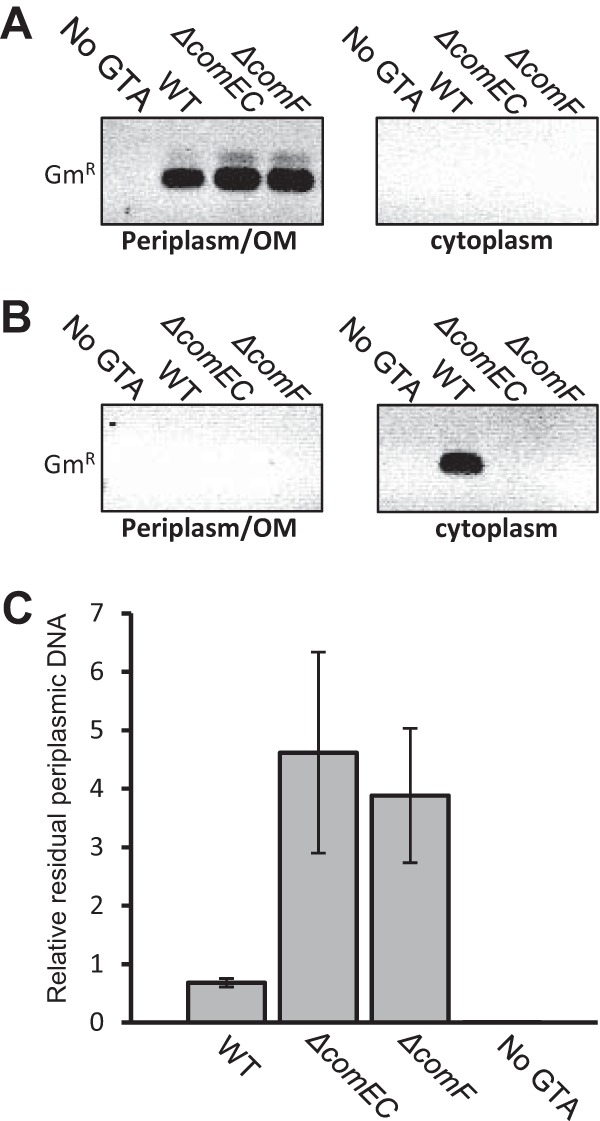
Tracking of RcGTA-borne DNA levels in the periplasm and cytoplasm of WT, ΔcomEC, and ΔcomF strains. (A) PCR products obtained from cell fractions after incubation with RcGTA for 3 h. (B) PCR products obtained from cell fractions after incubation with RcGTA for 24 h. (C) qPCR values, displayed as ratios of periplasmic RcGTA-borne DNA to chromosomal puhA levels. Error bars represent the standard deviations from the means (n ≥ 3). Statistical analysis was done by one-way ANOVA, with the results given in Table S6 in the supplemental material.