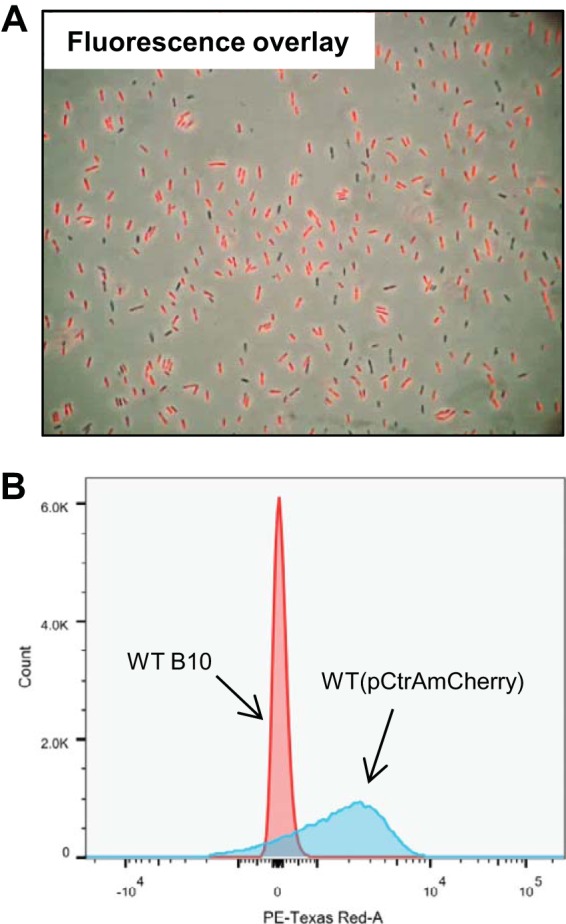
FIG 4.

(A) Fluorescence image where WT(pCtrAmCherry) cells were excited by 561-nm light (fluorescence emission, 610 nm) overlain on a light microscopy image of the same cells. (B) Flow cytometry graphical representation of WT cells containing the plasmid pCtrAmCherry, on which the mCherry fluorescent protein gene is driven by the ctrA promoter, compared to WT cells lacking the plasmid. The horizontal axis represents arbitrary fluorescence units, and the vertical axis gives cell counts (the total number of cells in each sample, indicated by the integrated area under each curve, was 50,000). PE, phycoerythrin.
