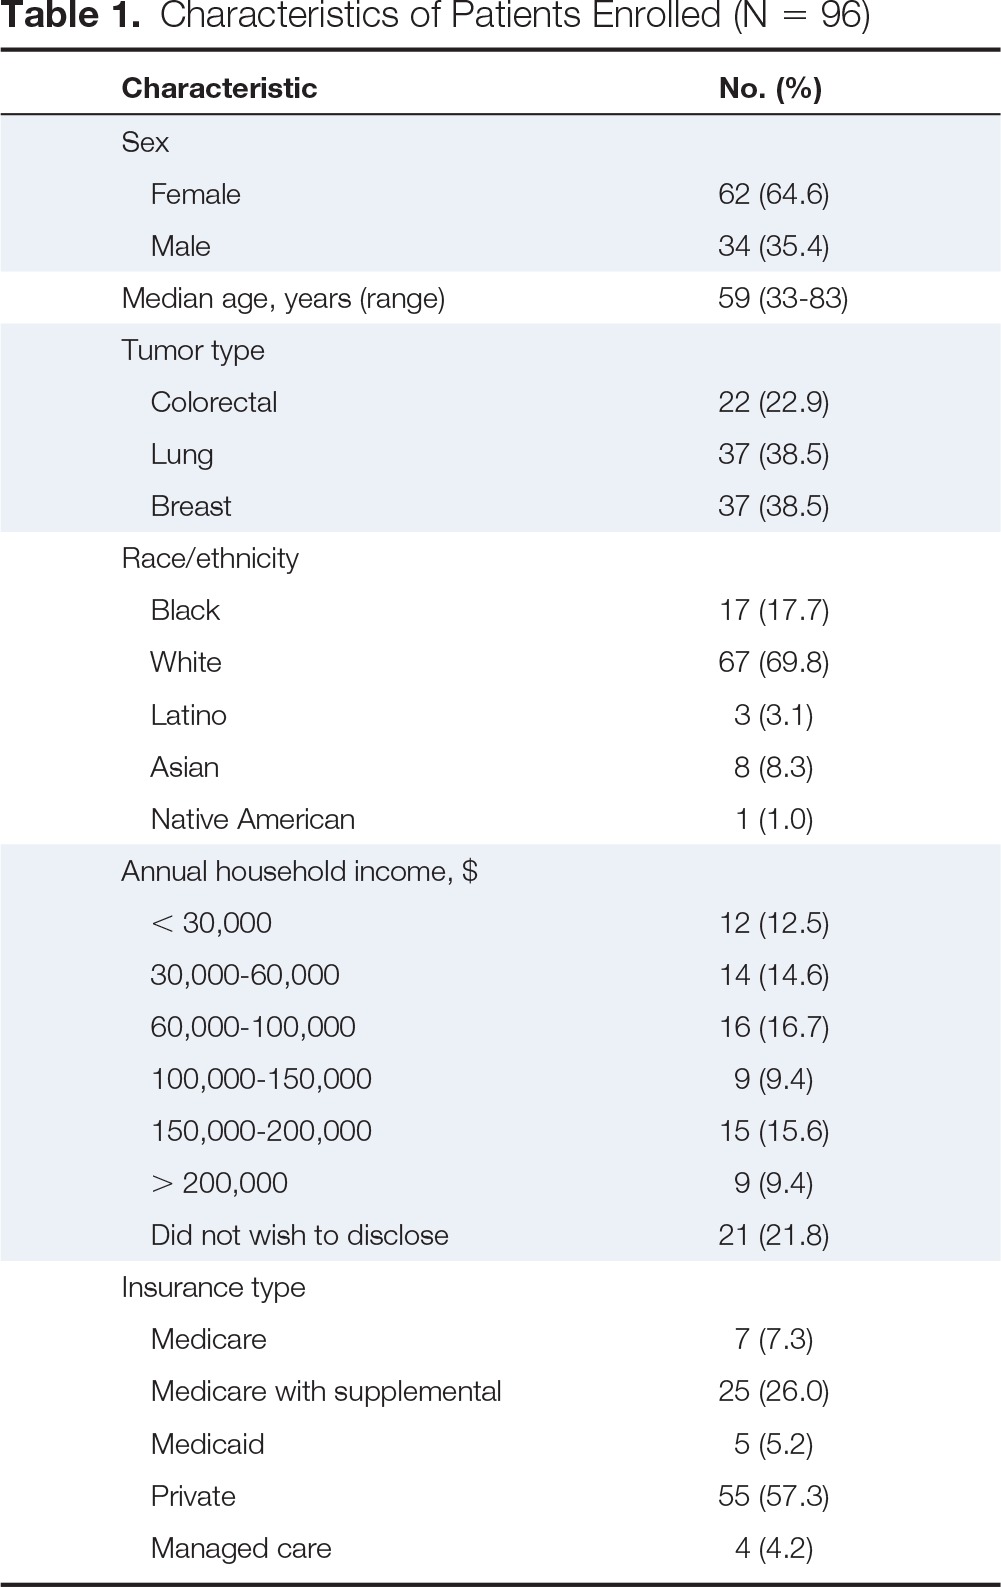
Table 1.
Characteristics of Patients Enrolled (N = 96)

| Characteristic | No. (%) |
|---|---|
| Sex | |
| Female | 62 (64.6) |
| Male | 34 (35.4) |
| Median age, years (range) | 59 (33-83) |
| Tumor type | |
| Colorectal | 22 (22.9) |
| Lung | 37 (38.5) |
| Breast | 37 (38.5) |
| Race/ethnicity | |
| Black | 17 (17.7) |
| White | 67 (69.8) |
| Latino | 3 (3.1) |
| Asian | 8 (8.3) |
| Native American | 1 (1.0) |
| Annual household income, $ | |
| < 30,000 | 12 (12.5) |
| 30,000-60,000 | 14 (14.6) |
| 60,000-100,000 | 16 (16.7) |
| 100,000-150,000 | 9 (9.4) |
| 150,000-200,000 | 15 (15.6) |
| > 200,000 | 9 (9.4) |
| Did not wish to disclose | 21 (21.8) |
| Insurance type | |
| Medicare | 7 (7.3) |
| Medicare with supplemental | 25 (26.0) |
| Medicaid | 5 (5.2) |
| Private | 55 (57.3) |
| Managed care | 4 (4.2) |
