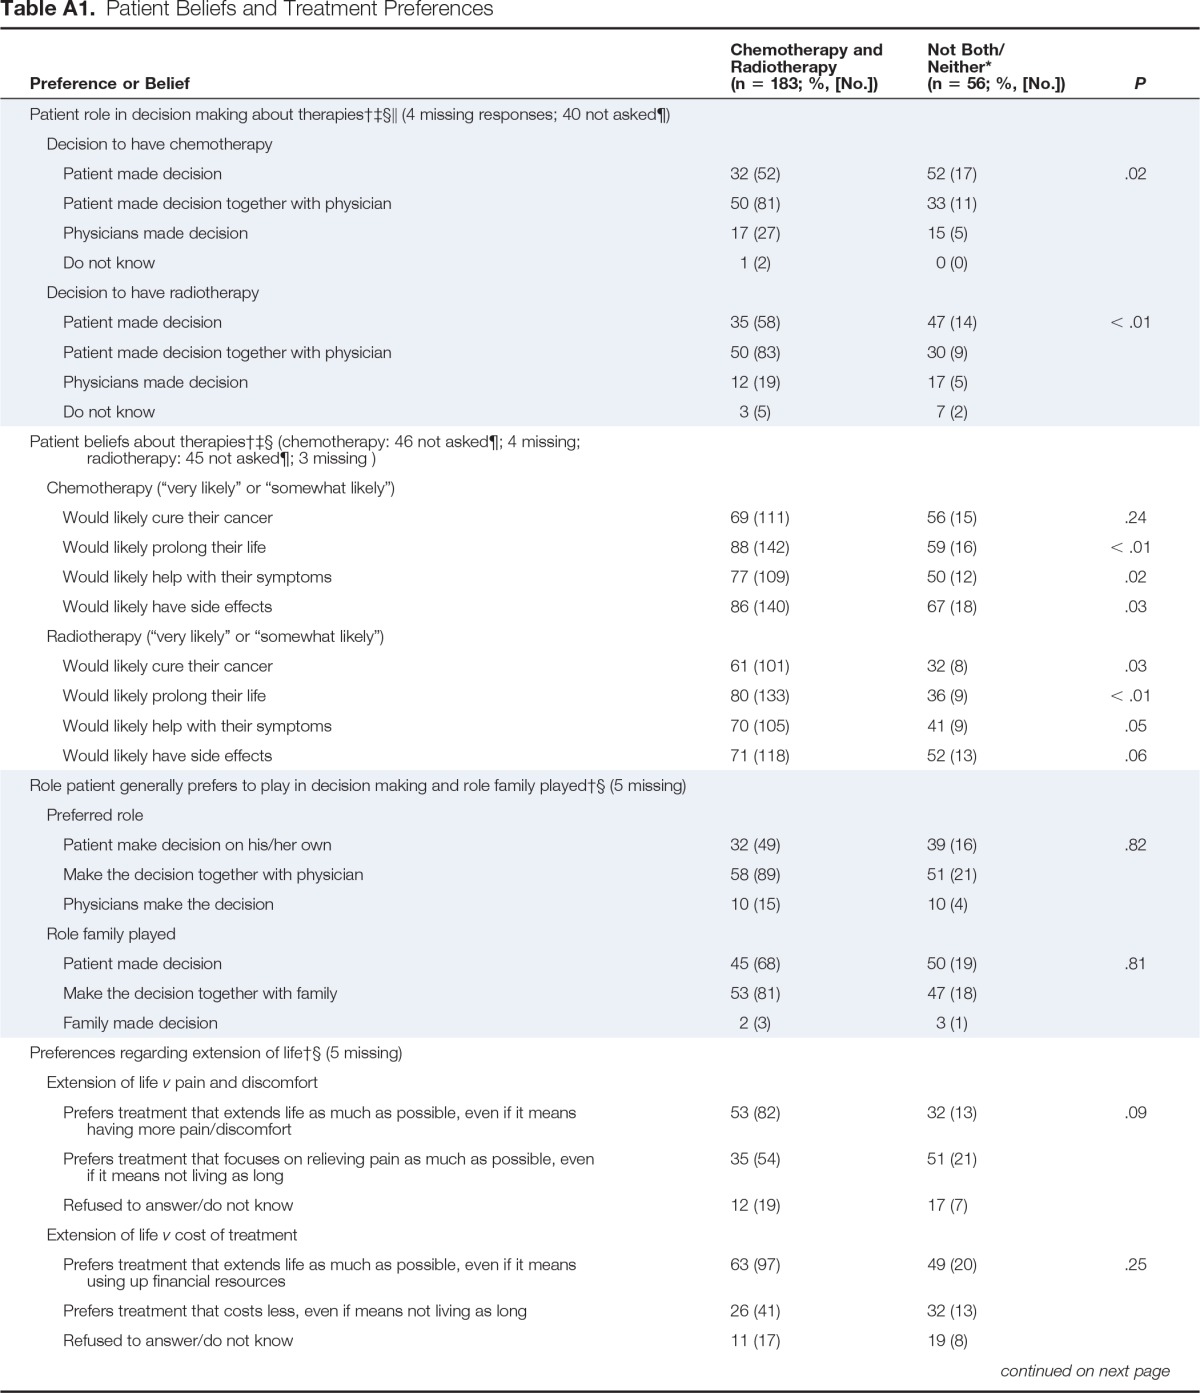
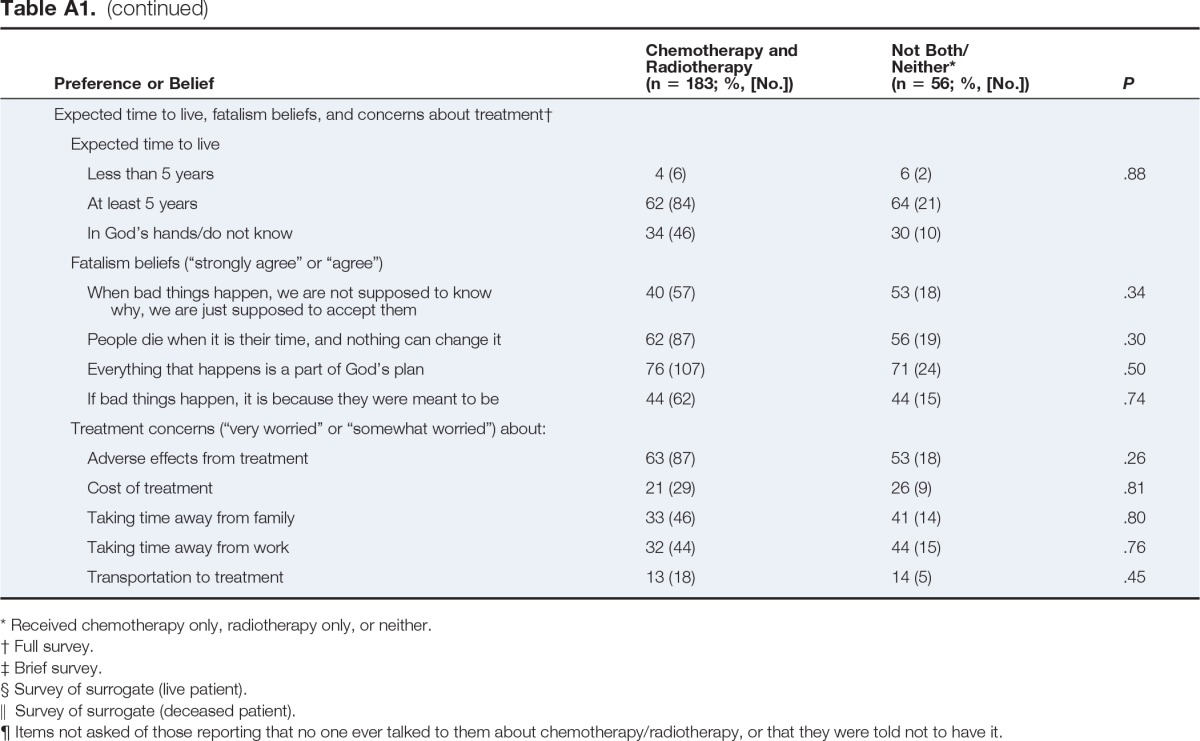
Table A1.
Patient Beliefs and Treatment Preferences


| Preference or Belief | Chemotherapy and Radiotherapy (n = 183; %, [No.]) | Not Both/Neither* (n = 56; %, [No.]) | P |
|---|---|---|---|
| Patient role in decision making about therapies†‡§‖ (4 missing responses; 40 not asked¶) | |||
| Decision to have chemotherapy | |||
| Patient made decision | 32 (52) | 52 (17) | .02 |
| Patient made decision together with physician | 50 (81) | 33 (11) | |
| Physicians made decision | 17 (27) | 15 (5) | |
| Do not know | 1 (2) | 0 (0) | |
| Decision to have radiotherapy | |||
| Patient made decision | 35 (58) | 47 (14) | < .01 |
| Patient made decision together with physician | 50 (83) | 30 (9) | |
| Physicians made decision | 12 (19) | 17 (5) | |
| Do not know | 3 (5) | 7 (2) | |
| Patient beliefs about therapies†‡§ (chemotherapy: 46 not asked¶; 4 missing; radiotherapy: 45 not asked¶; 3 missing ) | |||
| Chemotherapy (“very likely” or “somewhat likely”) | |||
| Would likely cure their cancer | 69 (111) | 56 (15) | .24 |
| Would likely prolong their life | 88 (142) | 59 (16) | < .01 |
| Would likely help with their symptoms | 77 (109) | 50 (12) | .02 |
| Would likely have side effects | 86 (140) | 67 (18) | .03 |
| Radiotherapy (“very likely” or “somewhat likely”) | |||
| Would likely cure their cancer | 61 (101) | 32 (8) | .03 |
| Would likely prolong their life | 80 (133) | 36 (9) | < .01 |
| Would likely help with their symptoms | 70 (105) | 41 (9) | .05 |
| Would likely have side effects | 71 (118) | 52 (13) | .06 |
| Role patient generally prefers to play in decision making and role family played†§ (5 missing) | |||
| Preferred role | |||
| Patient make decision on his/her own | 32 (49) | 39 (16) | .82 |
| Make the decision together with physician | 58 (89) | 51 (21) | |
| Physicians make the decision | 10 (15) | 10 (4) | |
| Role family played | |||
| Patient made decision | 45 (68) | 50 (19) | .81 |
| Make the decision together with family | 53 (81) | 47 (18) | |
| Family made decision | 2 (3) | 3 (1) | |
| Preferences regarding extension of life†§ (5 missing) | |||
| Extension of life v pain and discomfort | |||
| Prefers treatment that extends life as much as possible, even if it means having more pain/discomfort | 53 (82) | 32 (13) | .09 |
| Prefers treatment that focuses on relieving pain as much as possible, even if it means not living as long | 35 (54) | 51 (21) | |
| Refused to answer/do not know | 12 (19) | 17 (7) | |
| Extension of life v cost of treatment | |||
| Prefers treatment that extends life as much as possible, even if it means using up financial resources | 63 (97) | 49 (20) | .25 |
| Prefers treatment that costs less, even if means not living as long | 26 (41) | 32 (13) | |
| Refused to answer/do not know | 11 (17) | 19 (8) | |
| Expected time to live, fatalism beliefs, and concerns about treatment† | |||
| Expected time to live | |||
| Less than 5 years | 4 (6) | 6 (2) | .88 |
| At least 5 years | 62 (84) | 64 (21) | |
| In God's hands/do not know | 34 (46) | 30 (10) | |
| Fatalism beliefs (“strongly agree” or “agree”) | |||
| When bad things happen, we are not supposed to know why, we are just supposed to accept them | 40 (57) | 53 (18) | .34 |
| People die when it is their time, and nothing can change it | 62 (87) | 56 (19) | .30 |
| Everything that happens is a part of God's plan | 76 (107) | 71 (24) | .50 |
| If bad things happen, it is because they were meant to be | 44 (62) | 44 (15) | .74 |
| Treatment concerns (“very worried” or “somewhat worried”) about: | |||
| Adverse effects from treatment | 63 (87) | 53 (18) | .26 |
| Cost of treatment | 21 (29) | 26 (9) | .81 |
| Taking time away from family | 33 (46) | 41 (14) | .80 |
| Taking time away from work | 32 (44) | 44 (15) | .76 |
| Transportation to treatment | 13 (18) | 14 (5) | .45 |
Received chemotherapy only, radiotherapy only, or neither.
Full survey.
Brief survey.
Survey of surrogate (live patient).
Survey of surrogate (deceased patient).
Items not asked of those reporting that no one ever talked to them about chemotherapy/radiotherapy, or that they were told not to have it.
