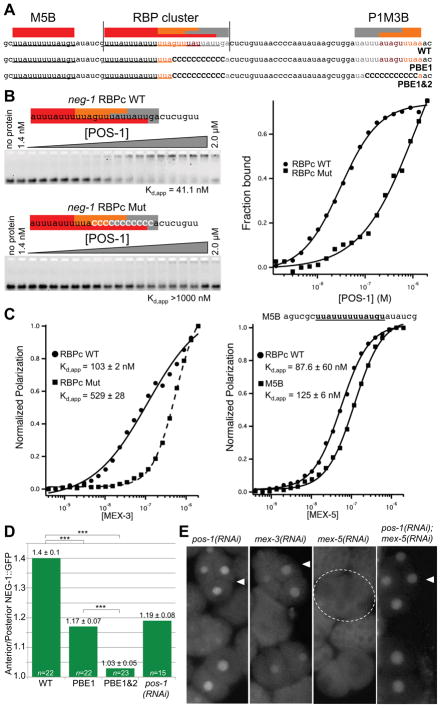
Figure 3. POS-1 and MEX-5 bind and regulate the expression of neg-1 mRNA.
(A) Nucleotide sequence of a portion of the neg-1 mRNA 3′UTR indicating predicted binding sites for POS-1 (grey), MEX-3 (orange) and MEX-5 (red). Wild-type (WT) and two sequences with mutations in the POS-1 consensus elements (PBE1 and PBE1&2) are shown.
(B) Fluorescence electrophoretic mobility shift assays with recombinant POS-1 and fluorescently labeled wild-type (RBPc WT) and mutant (RBPc Mut) fragments of the neg-1 RBP cluster (as indicated). The mobility of each labeled probe is shown after incubation with increasing amounts of POS-1 protein as indicated at top of the gel images. The apparent dissociation constant, Kd,app indicated below the gel images, represents the average of three independent replicates ± the standard deviation, SD. A graphical quantification of the data is shown at right.
(C) Graphical representations of fluorescence polarization data obtained from incubating the fluorescent probes (as indicated) with increasing amounts of MEX-3 (Left graph) or MEX-5 (Right Graph). The RBP cluster probes were the same as those used in (B). The sequence of the MEX-5 B probe (M5B) is shown above the right graph. The Kd,app values were calculated as described in (B).
(D) Graphical representation of relative Anterior/Posterior GFP intensity observed in 4-cell stage embryos transgenic for neg-1 promoter-driven GFP under the control of the neg-1 wild-type (WT) or mutated the neg-1 3′UTR. The mutations in the PBE1 and PBE1&2 UTRs are shown in (A). Relative Anterior/Posterior GFP intensity after pos-1(RNAi) is also indicated for comparison. The y-axis indicates the average ratio of GFP intensity in the “Anterior” (ABa + ABp) divided by intensity in the “Posterior” (EMS + P2) (see Experimental Procedures). Data are represented as mean ± standard deviation and *** indicates a t-test p-value < 0.0001. Sample size (n) is indicated for each column.
(E) GFP fluorescence micrographs showing the expression of a wild-type NEG-1::GFP reporter in representative wild-type embryos (WT) and embryos depleted by RNAi of various RBPs (as indicated).

