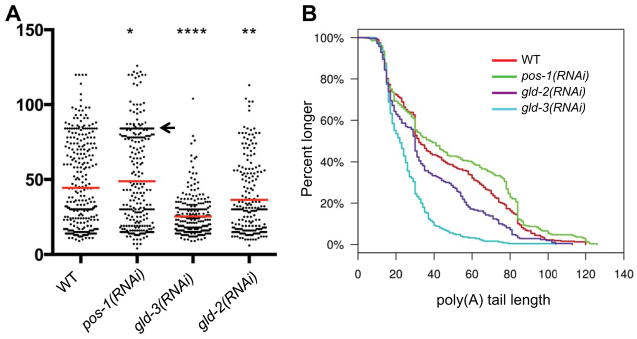
Figure 4. POS-1, GLD-3 and GLD-2 regulate neg-1 mRNA poly(A)-tail length.

(A) Graphical representation of neg-1 mRNA Poly(A) tail lengths as detected by PAT-seq analysis of RNA prepared from WT and mutant early embryos (as indicated). Each dot represents a cDNA sequence and the number A residues in its poly(A) tail corresponding to its placement on the y-axis. A high density of dots may appear as a black line. The Red bar reflects the median according to Kolmagorov-Smirnov test. Asterisks indicate statistical significance (*) P ≤ 0.05, (**) P ≤ 0.01 and (****) P ≤ 0.0001. Arrow notes a range of overrepresented poly(A) tail lengths in WT, which increases in pos-1(RNAi) early embryos.
(B) A continuous histograms demonstrating the percentage of poly(A) tails (y-axis) longer than a given length (x-axis) in each genotype tested.
