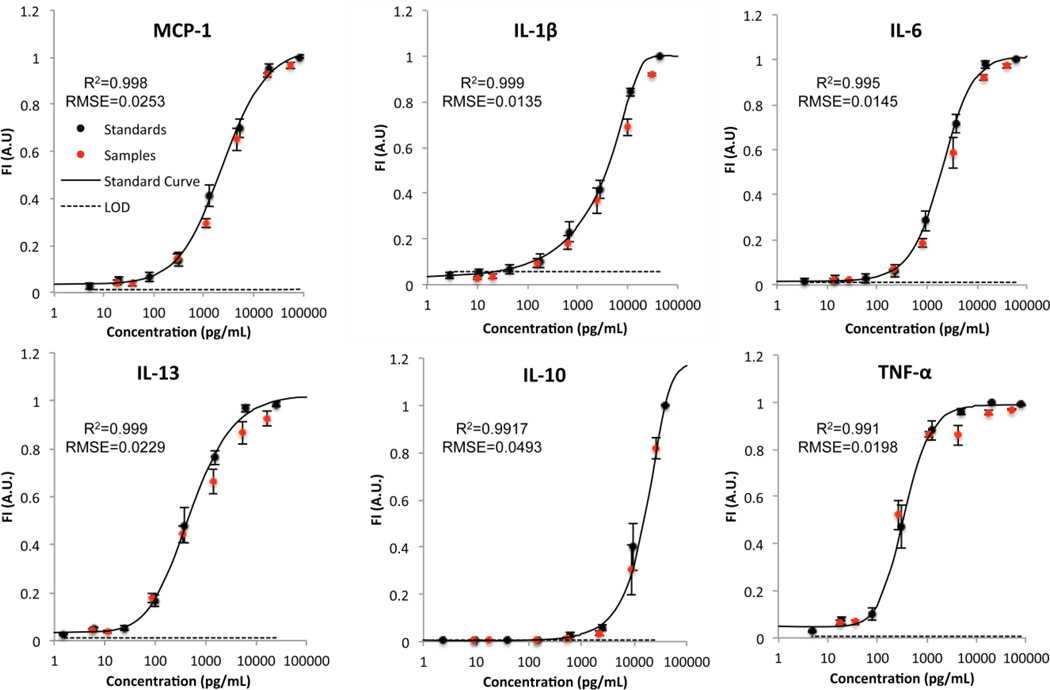
Fig. 3.
Standard curves, sample measurements, and noise floor. Fluorescence intensities of the standards (black circles) and spiked samples of known concentrations (red circles) are shown overlaid on the standard curve generated using a 5-parameter logistic curve fit (black line). The limit of detection (LOD) is represented by the dotted black line. The error bars represent ± S.E.M., n=10 for each data point. RMSE=Root Mean Squared Error

