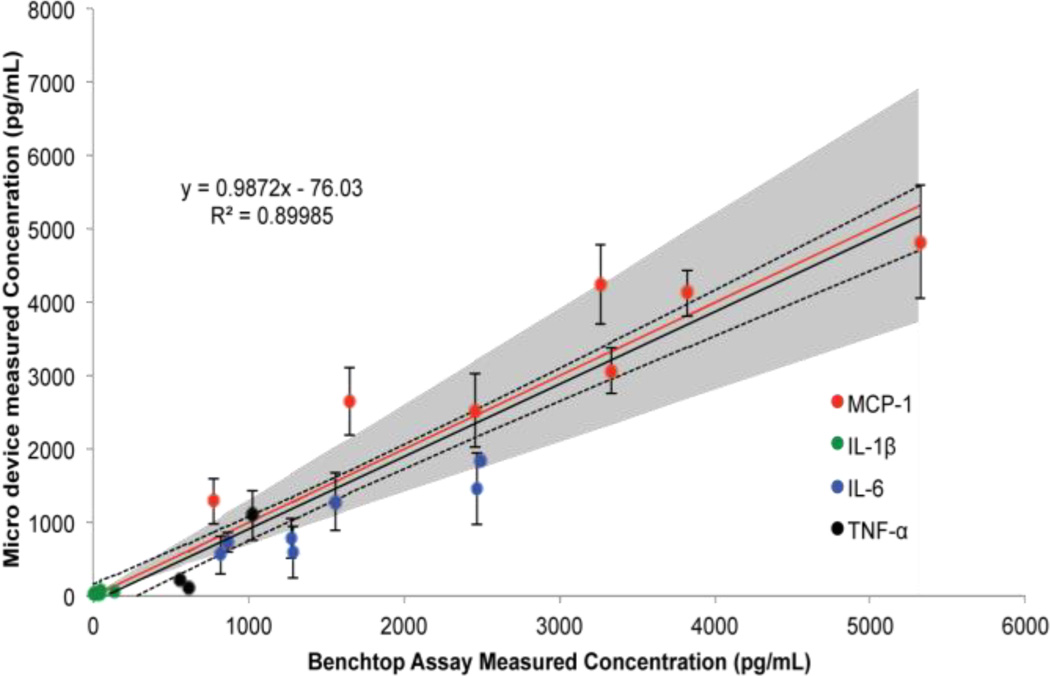
Fig. 5.
Comparison of quantification of in vitro supernatants using commercially available multiplex immunoassay reagents in the conventional and microfluidic assay formats. A linear regression (black line), 95% confidence interval of the fit (dotted lines), and line representing a perfect agreement (red line) are shown. The gray shaded region represents a ±30% error accepted by the pharmaceutical industry for biomarker discovery immunoassays. The error bars represent ±S.E.M., n=6 for each data point

