Figure 3.
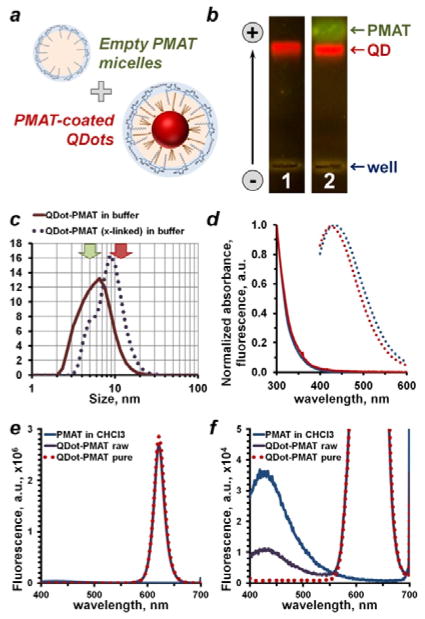
Purification of polymer-coated QDots and purity control strategies. (a) Polymer encapsulation procedure produces polymer-coated QDots along with an excess of “empty” polymer micelles, which feature surface functional groups similar to QDots and, therefore, compete with polymer-coated QDots in downstream bioconjugation and bioassays. Purification strategies taking this mimicry into account are required. (b) Detection of free PMAT micelles with agarose gel electrophoresis. Featuring similar surface charge density, but smaller size, PMAT traveled slightly faster than QDots. Presence of PMAT was detected in a non-purified sample by staining with SYBR Gold (lane 2), whereas purified QDots (lane 1) lacked a PMAT band. (c) Empty PMAT micelles also shifted DLS size distribution of a non-purified sample toward smaller size, hampering accurate measurement of nanoparticle size. Typical PMAT micelle and QDot sizes are indicated by green and red arrows, respectively. (d) Optical properties of PMAT in chloroform (blue curves) and an aqueous 50 mM Borate buffer (red curves). Polymer showed absorbance of light in 300–400 nm range (solid lines) and blue fluorescence emission (dotted lines) peaking at 430 nm when excited at 350 nm. This feature proved instrumental in detecting free PMAT and evaluating the QDot purity. While fluorescence spectrum of polymer-coated QDots remained unchanged after purification (e), clearly detectable PMAT fluorescence peak in a non-purified sample disappeared following purification (f). Interestingly, PMAT fluorescence intensity also dropped following deposition onto QDots (f, blue vs. purple curve), indicating suppression of the PMAT fluorescence by QDots in close proximity.

