Figure 3.
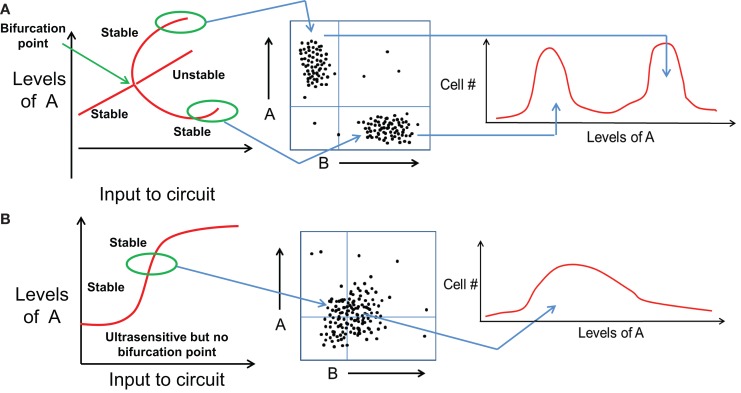
Distinct cell fates vs. quantitative trait variation of same cell fate. (A) (Left) bifurcation diagram representing variation in levels of A as an input is applied to a bistable mutually inhibitory circuit between A and B. At some threshold value of the input signal (marked by bifurcation point), the initial cell fate disappears and gives rise to two new stable steady state or cell fates. (middle) These two cell fates can be observed as different subpopulations in a FACS experiment. (right) Most cells attain one of the two cell fates, and the population distribution is bimodal with different range of values of A. (B) (left) Bifurcation diagram representing variation in levels of A as an input is applied to a monostable mutually inhibitory circuit between A and B. The circuit responds in an ultrasensitive manner but no bifurcation of cell fates observed. (middle) FACS experiments show a population with continuously varying levels of A without any sharp boundaries, hence (right) the population distribution is unimodal and broadly Gaussian.

