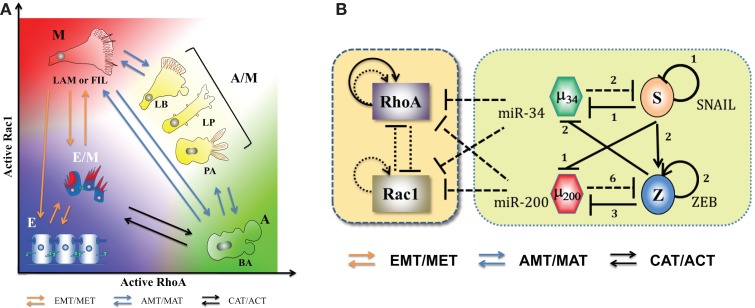
Figure 6.
Landscape of cellular shape plasticity during carcinoma metastasis. (A) Cartoon representation of different cell shapes/phenotypes with their respective places on the two-dimensional space of levels of active RhoA (RhoA-GTP) and active Rac1 (Rac1-GTP). As miR-34 and miR-200 inhibit both RhoA and Rac1, both epithelial and hybrid E/M phenotypes have low levels of active forms of RhoA and Rac1. The (high RhoA-GTP, low Rac1-GTP) profile associates with amoeboid (A) morphology with blebs [blebby amoeboid (BA)], whereas (low RhoA-GTP, high Rac1-GTP) associates with mesenchymal (M) shape – cells with lamellopodia or filopodia (LAM or FIL). Cells with (high RhoA-GTP, high Rac1-GTP) adopt a hybrid A/M morphology that can be manifested in multiple ways – lamellipoida with blebs (LB), lobopodia (LP), and pseudopodal amoeboid (PA). Transitions among E, E/M, and M phenotypes (EMT/MET) are represented by orange arrows, those between amoeboid and mesenchymal morphologies – A, A/M, and M – are denoted by blue arrows, and transitions between E/M and A phenotypes – CAT/ACT – are denoted by black arrows. (B) Circuits showing the coupling of core EMT circuit with RhoA and Rac1 – the two GTPases that are critical in regulating cell shape. They inhibit the GTP loading (switching from inactive GDP-bound state to active GTP-bound state) of each other and promote that of themselves (shown by dotted lines). Also, RhoA can activate itself indirectly on a transcription level (solid black lines) (see Ref. (74) and references therein). The microRNAs miR-34 and miR-200 inhibit the translation of RhoA and Rac1. Figure adapted from Ref. (74).

