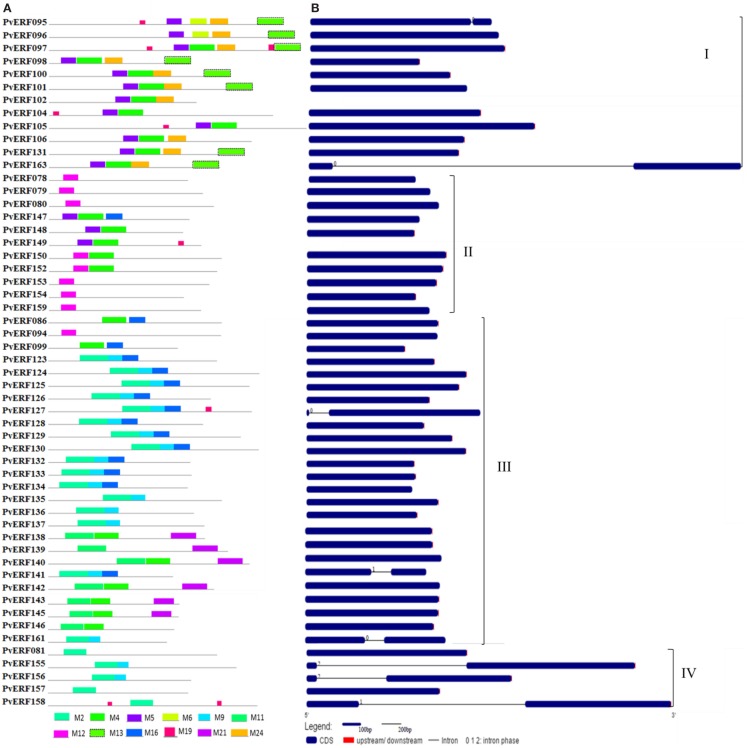
Figure 3.
The schematic representation of protein and gene structures of switchgrass DREB subfamily. (A) Distribution of conserved motifs within the deduced amino acid sequences as determined by MEME tool (Bailey and Elkan, 1994). The colored boxes represent the conserved motifs. (B) The gene features as visualized by the gene structure display server (Guo et al., 2007). The coding DNA sequence (CDS) and the untranslated regions (UTR) are shown by filled dark-blue and red boxes, respectively. The introns are shown by thick black lines. The splicing phases of the introns are indicated by numbers. The Roman numerals indicate the group of the genes within the subfamily.

