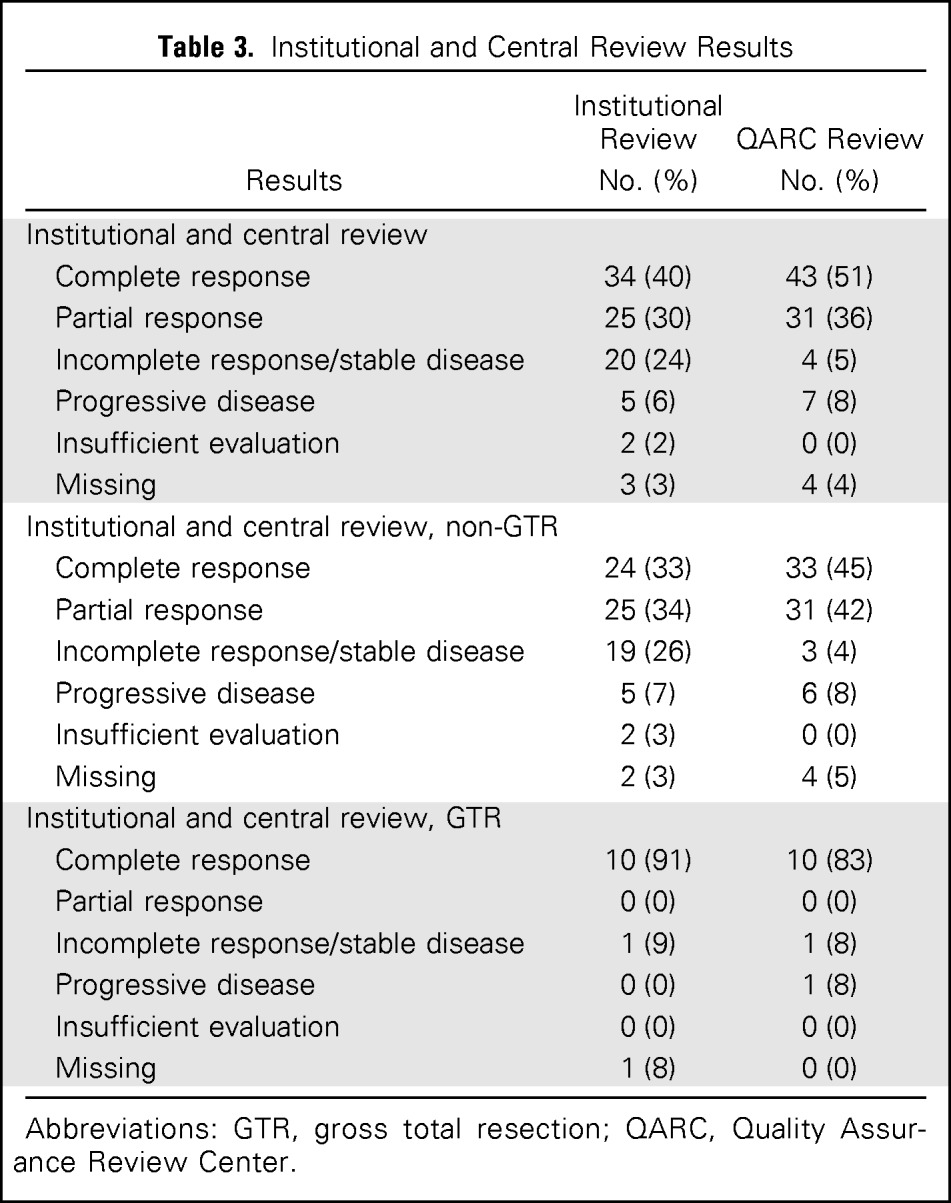
Table 3.
Institutional and Central Review Results

| Results | Institutional Review No. (%) | QARC Review No. (%) |
|---|---|---|
| Institutional and central review | ||
| Complete response | 34 (40) | 43 (51) |
| Partial response | 25 (30) | 31 (36) |
| Incomplete response/stable disease | 20 (24) | 4 (5) |
| Progressive disease | 5 (6) | 7 (8) |
| Insufficient evaluation | 2 (2) | 0 (0) |
| Missing | 3 (3) | 4 (4) |
| Institutional and central review, non-GTR | ||
| Complete response | 24 (33) | 33 (45) |
| Partial response | 25 (34) | 31 (42) |
| Incomplete response/stable disease | 19 (26) | 3 (4) |
| Progressive disease | 5 (7) | 6 (8) |
| Insufficient evaluation | 2 (3) | 0 (0) |
| Missing | 2 (3) | 4 (5) |
| Institutional and central review, GTR | ||
| Complete response | 10 (91) | 10 (83) |
| Partial response | 0 (0) | 0 (0) |
| Incomplete response/stable disease | 1 (9) | 1 (8) |
| Progressive disease | 0 (0) | 1 (8) |
| Insufficient evaluation | 0 (0) | 0 (0) |
| Missing | 1 (8) | 0 (0) |
Abbreviations: GTR, gross total resection; QARC, Quality Assurance Review Center.
