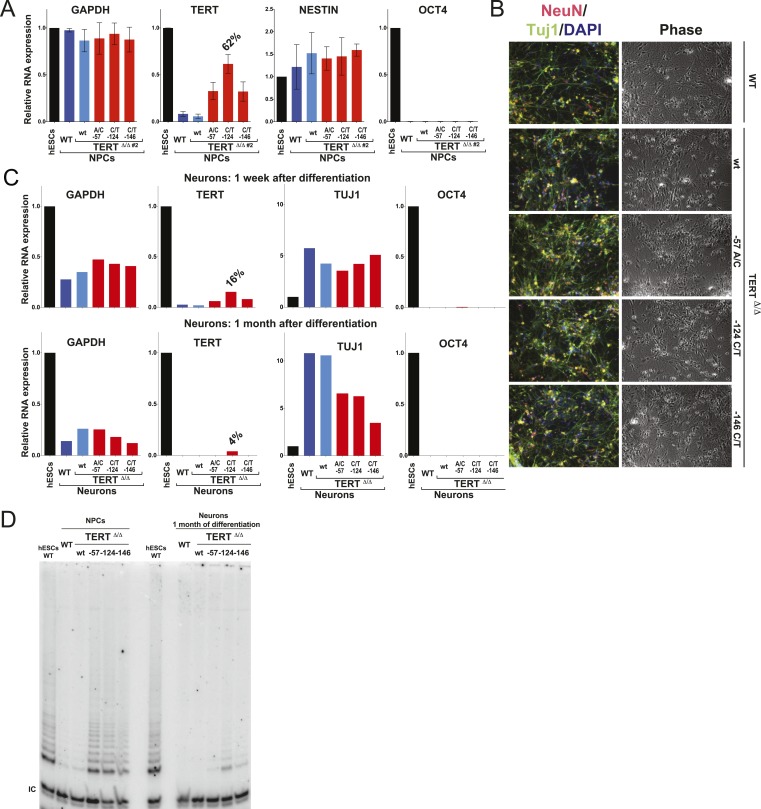
Figure 4. Neural precursors and neurons differentiated from the promoter mutation hESCs failed to repress TERT and telomerase activity.
(A) Quantitative RT-PCR of GAPDH, TERT, NESTIN, and OCT4 in the neural precursors carrying the promoter mutations 20–25 days after differentiation from hESCs. Expression levels are relative to the WT hESCs. (B) Phase-contrast and immunofluorescence images of neurons differentiated from wild-type hESCs or the TERT promoter mutation-containing hESCs. Shown are cells 28 days after neural induction from NPCs and treated with mitotic inhibitor for 16 days. The left panel shows IF staining against NeuN (red), Tuj1 (green), and DAPI staining (blue). (C) Quantitative RT-PCR of GAPDH, TERT, TUJ1, and OCT4 in the neurons carrying the promoter mutations. The top panel shows expression levels of neurons 7 days after neuronal differentiation from NPCs. The bottom panel shows expression levels of neurons 28 days after induction of neuronal differentiation from NPCs and treated with mitotic inhibitor for 16 days. Expression level is relative to the WT hESCs. (D) TRAP assay of whole cell extracts from NPCs (35 days after differentiation from hESCs) and neurons (28 days after neuronal differentiation from NPCs and treated with mitotic inhibitor for 16 days) using 1 µg protein.


