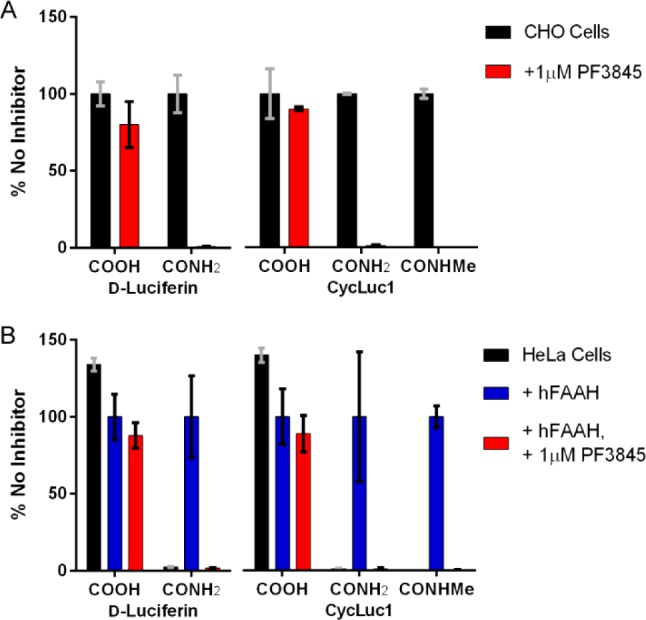
Figure 3.

(A) Relative photon flux from live luciferase-expressing CHO cells treated with the indicated luciferins and luciferin amides (125 μM) in the absence (black bars) or presence (red bars) of the FAAH inhibitor PF3845. The data are normalized to the uninhibited sample for each luciferin (black bars). (B) Relative flux from live luciferase-expressing HeLa cells treated with the same set of substrates after transfection with empty pcDNA3.1 vector (black bars), pcDNA3.1-hFAAH (blue bars), or pcDNA3.1-hFAAH and treatment with the FAAH inhibitor PF3845 (red bars). The data are normalized to the uninhibited hFAAH-transfected sample for each luciferin (blue bars). All assays were performed in triplicate and are represented as the mean ± SEM.
