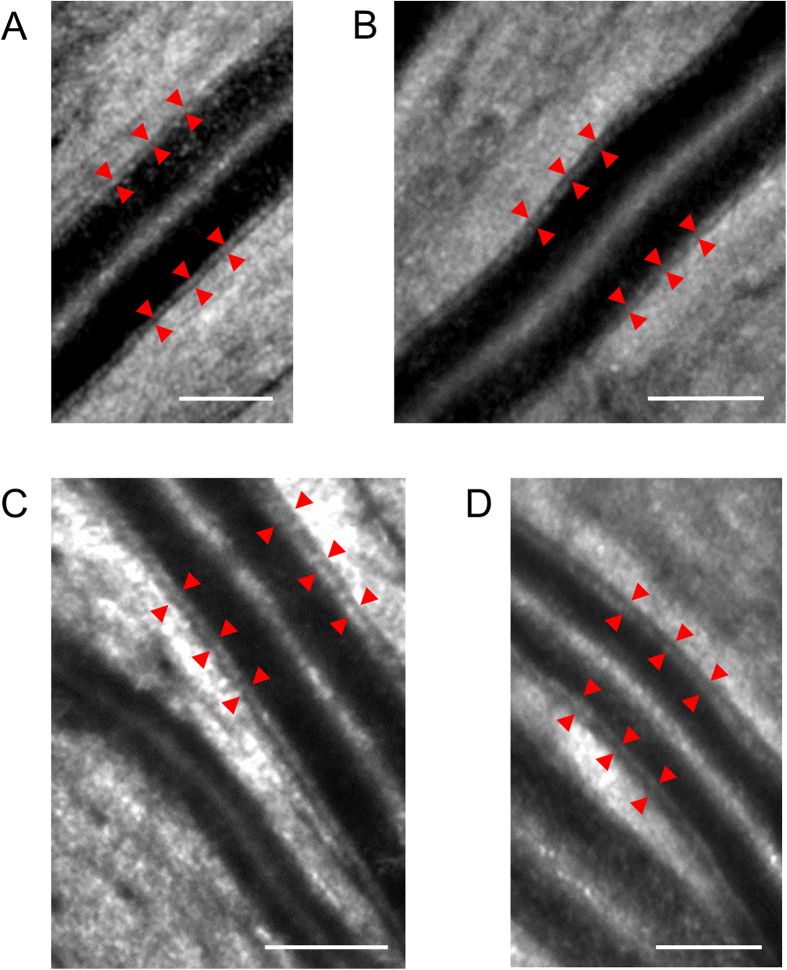
Figure 2. Adaptive optics scanning laser ophthalmoscopy images for wall visualization.
(a) A 24-year-old woman with a blood pressure of 89/55 mmHg and normal wall thickness. The wall-to-lumen ratio (WLR) was 0.176, and the wall thickness (WT) was 20.2 μm. Red arrows indicate the arterial wall. Scale bar, 100 μm. (b) A 43-year-old man with a blood pressure of 118/73 mmHg and normal wall thickness. The WLR was 0.204, and the WT was 20.9 μm. Scale bar, 100 μm. (c) A 61-year-old man with a blood pressure of 154/92 mmHg and a thickening wall. The WLR was 0.321, and the WT was 31.7 μm. Scale bar, 100 μm. (d) A 57-year-old man with a blood pressure of 140/86 mmHg and a thickening wall. The WLR was 0.332, and the WT was 32.7 μm. Scale bar, 100 μm.

