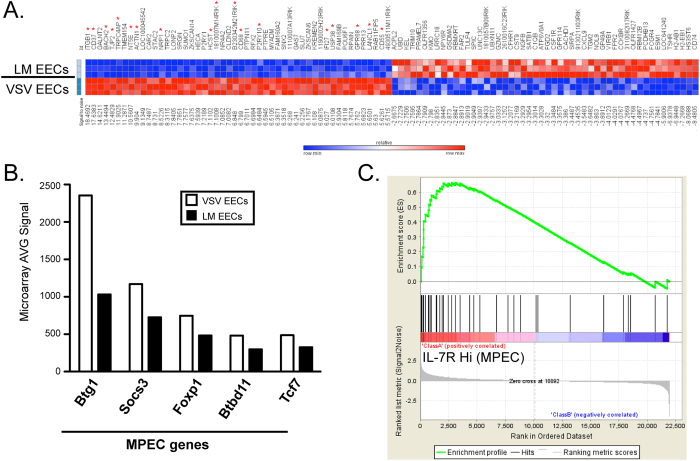
Figure 3. Whole genome microarray studies reveal a subset of genes differentially expressed in EECs generated after LM versus VSV infection.
A. mRNA Expression levels were measured by microarray analysis with Illumina BeadChips of sorted EECs, as in Fig. 2A, 5 days following LM-OVA or VSV-OVA infection. The top 50 and bottom 50 differentially regulated genes, ranked by signal-to-noise, are displayed. Each row represents an individual sample. B. The AVG signal from the microarray of LM or VSV EECs for selected MPEC genes is graphed. C. Enrichment profile generated from GSEA using the top 50 genes enriched in VSV EECs compared to a gene set generated with IL-7RHi (MPEC) and IL-7RLo (SLEC) samples. Genes identified as being enriched in both VSV EECs and IL-7RHi cells (MPECs) are marked with a red asterisk in part A.

