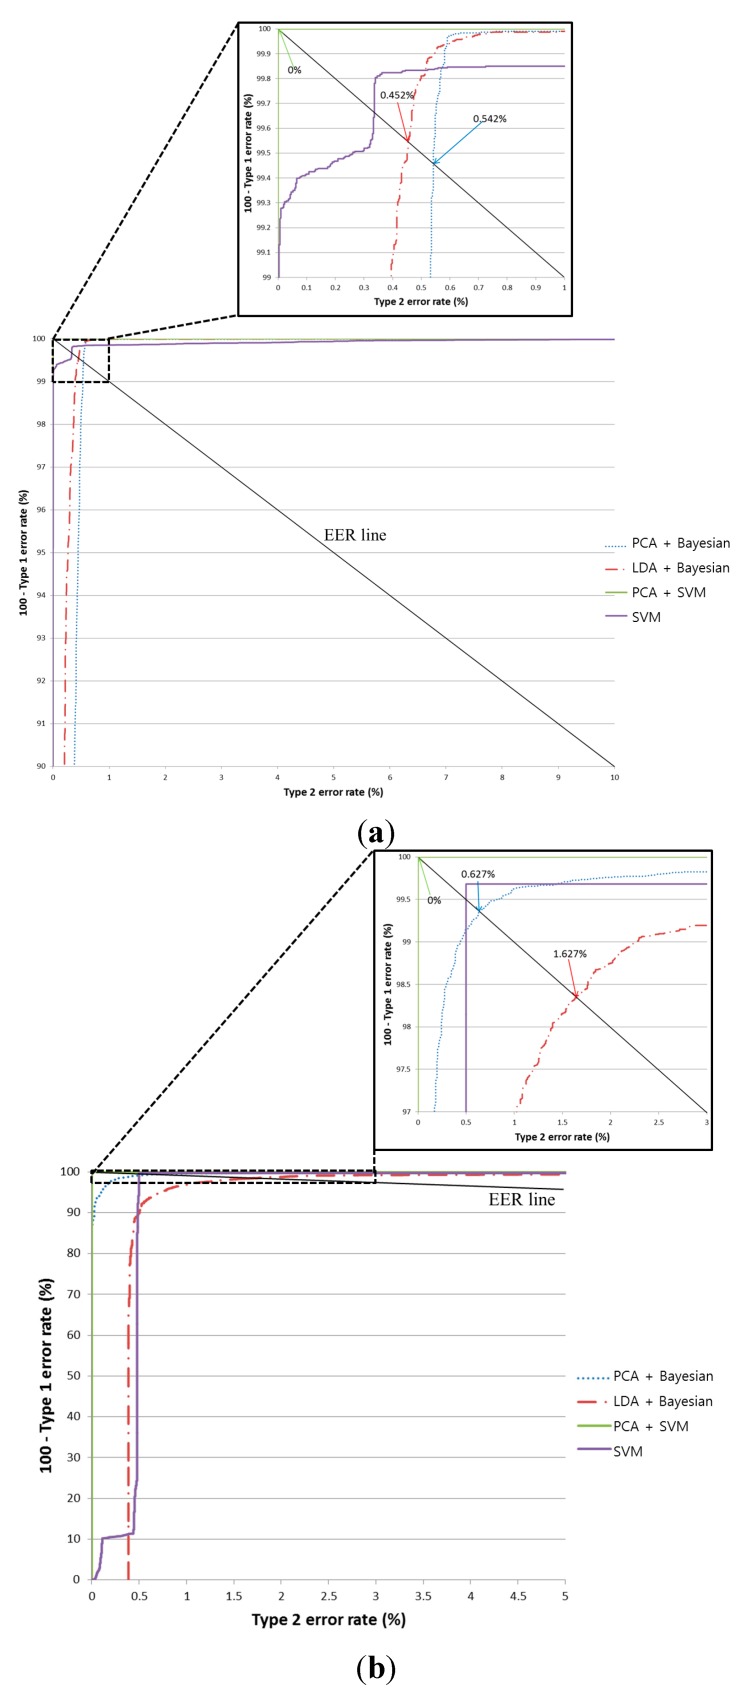
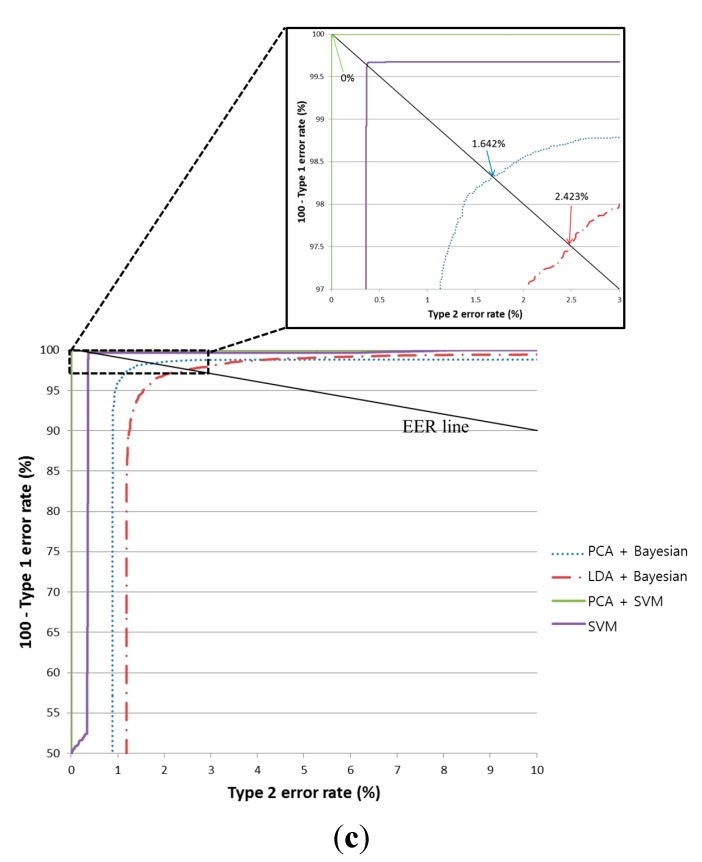
Figure 7.
ROC curve from the pre-classification stage using two testing sub-databases (In each figure, PCA+SVM is the proposed method): (a) the average classification results for the obverse side (Direction A or B) and the reverse side (Direction C or D); (b) the average classification results for Direction A and Direction B; and (c) the average classification results for Direction C and Direction D.


