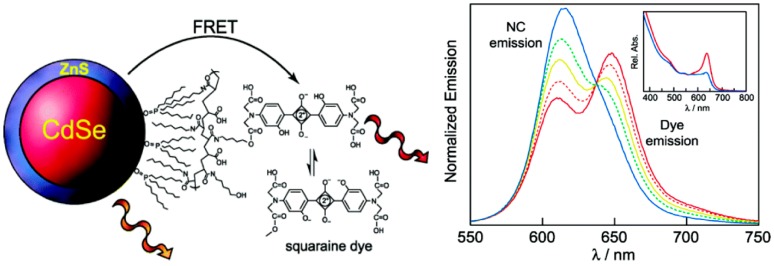
Figure 6.
Schematic illustration of the sensor construction and the pH-dependent emission profiles. The squaraine absorption suppression in basic condition is shown in the inset (Reprinted with permission from [88], Copyright 2006 American Chemical Society).

