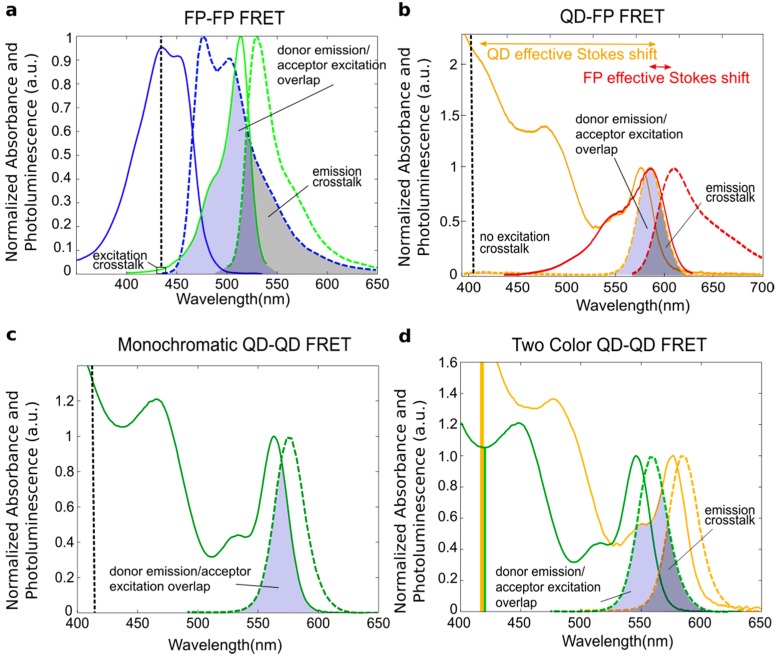
Figure 4.
Normalized excitation and emission spectra of four different FRET pairs with schematized spectral overlaps shown. (a) Enhanced cyan fluorescent protein (ECFP, blue, donor) and enhanced yellow fluorescent protein (EYFP, green, acceptor); (b) A 3.7 nm CdSe/ZnS QD (orange, donor) and the fluorescent protein mCherry (red, acceptor); (c) A 3.3 nm diameter CdSe/ZnS QD acting as both donor and acceptor; (d) A 2.9 nm diameter CdSe/ZnS QD (green, donor) and 3.7 nm diameter CdSe/ZnS QD (yellow, acceptor). The vertical dotted black line in (a,b,c) indicates the expected excitation wavelength with the box indicating excitation crosstalk (i.e., where both the donor and the acceptor absorb the excitation light); In (d), the excitation crosstalk is represented with yellow and green bars, demonstrating that the acceptor has a significantly larger absorption than the donor, making excitation crosstalk a significant issue. The spectral overlap between the donor emission and acceptor excitation is shaded blue; the emission crosstalk (i.e., overlap between the donor and acceptor emission) is shaded grey. (a,b) were made using FP spectral data from [58].

