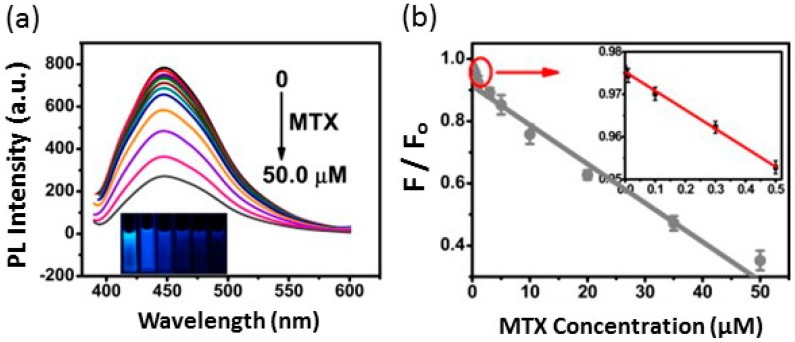
Figure 1.
(a) The fluorescence spectra of NS-co-doped fluorescent carbon nanodots (NSCDs) as treated with different concentrations of methotrexate (MTX) ranging from 0–50.0 µM; the intensity decreases as the concentration of MTX increases and FRET is inhibited. The inset shows photographs that correspond to the increasing concentrations of MTX; (b) The linear relationship between fluorescence and MTX concentration. Reproduced with permission from Wang et al. [42]. Copyright 2015 Biosensors and Bioelectronics, Elsevier. PL, photoluminescence.

