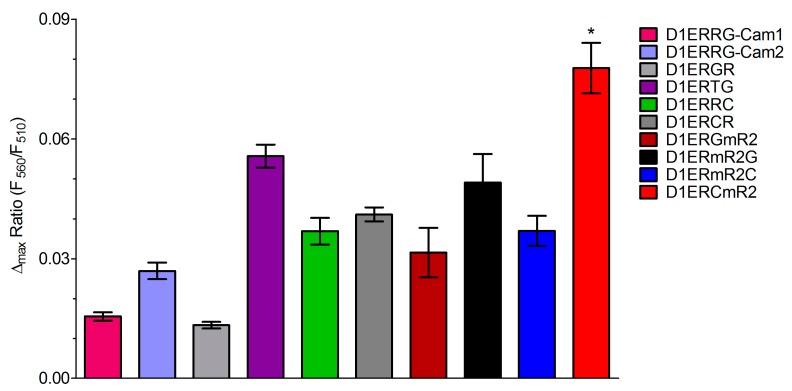
Figure 3.
Column statistics of maximal ER Ca2+-release in HeLa cells transfected with individual GFP/RFP-based cameleons. Bars representing FRET change upon treatment with 100 µM histamine and 15 µM BHQ detected by D1ERRG-Cam1 (pink bar, n = 13), D1ERRG-Cam2 (purple bar, n = 10), D1ERGR (light grey bar, n = 4), D1ERTG (violet bar, n = 7), D1ERRC (light green bar, n = 10), D1ERCR (grey bar, n = 4), D1ERGmR2 (black bar, n = 11), D1ERmR2G (dark red bar, n = 6), D1ERmR2C (blue bar, n = 11) or D1ERCmR2 (red bar, n = 7). * P < 0.05 for D1ERCmR2 vs. all other indicators.

