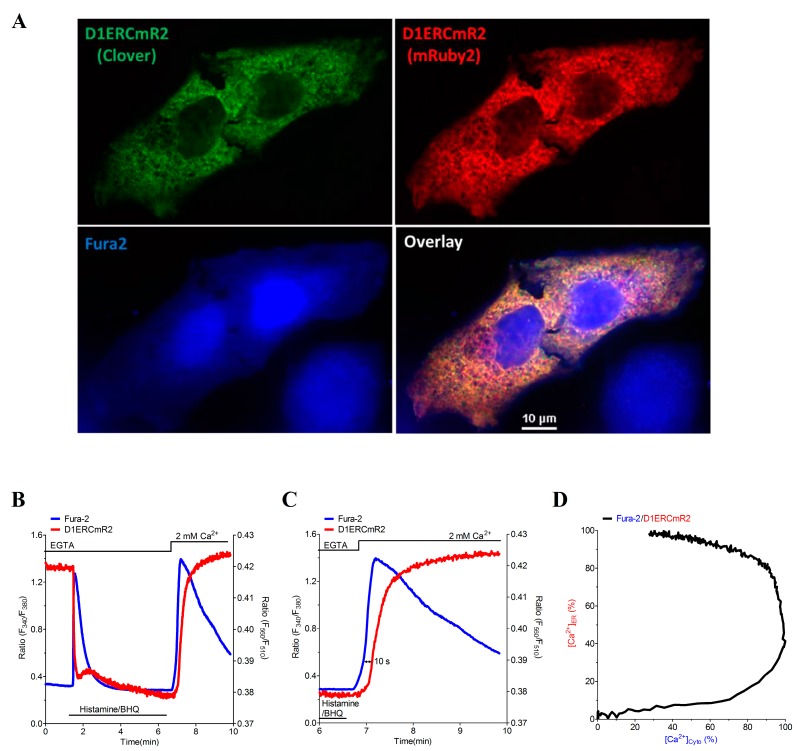
Figure 5.
Dual visualization of fura-2 and D1ERCmR2 in single individual HeLa cells. (A) Confocal images of D1ERCmR2 expressing and fura-2 loaded HeLa cells. Subcellular structures of D1ERCmR2 were either illuminated at 473 or 515 nm and emissions were recorded at 525 (Clover, upper left panel) or 570 nm (mRuby2, upper right panel), respectively. Fura-2 was excited at 405 and emitted light was imaged at 460 nm (lower left panel). Images overlaid (lower right panel); (B) Representative curves of cytosolic and ER [Ca2+] in a single HeLa cell treated with 100 µM Histamine and 15 µM BHQ in a nominal Ca2+ free buffer and subsequent readdition of 2 mM Ca2+; (C) Zoom into event of SOCE reveals a delayed ER Ca2+ refilling; (D) Spatiotemporal correlation of [Ca2+]Cyto and [Ca2+]ER during SOCE in percentage of the maximum increase shown in panel C.

