
Figure 4.
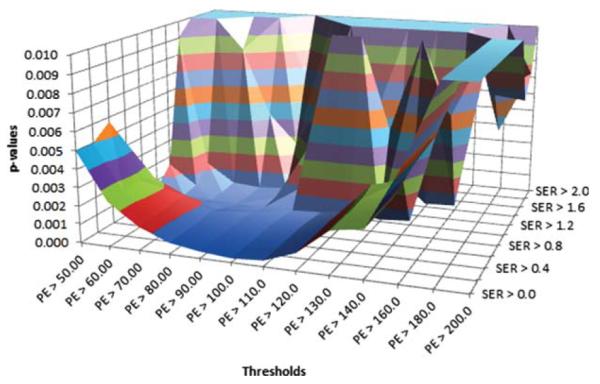
P-values for percent change in FTV over treatment. P-values for model fit are depicted for combined PE (x-axis) and SER (z-axis) thresholds.
Official websites use .gov
A
.gov website belongs to an official
government organization in the United States.
Secure .gov websites use HTTPS
A lock (
) or https:// means you've safely
connected to the .gov website. Share sensitive
information only on official, secure websites.
P-values for percent change in FTV over treatment. P-values for model fit are depicted for combined PE (x-axis) and SER (z-axis) thresholds.