
Figure 3.
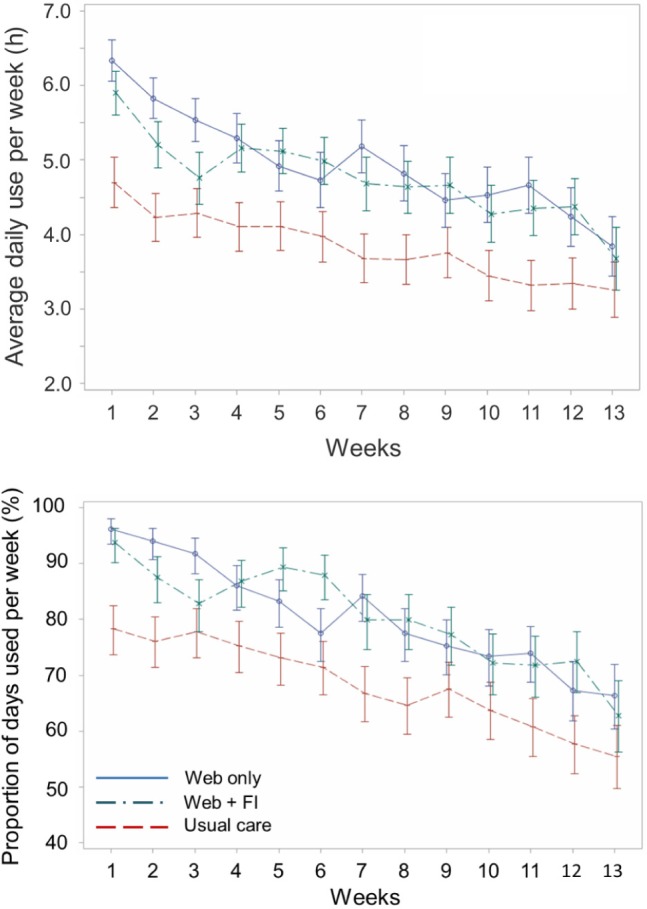
Mean (standard deviation) daily hours of positive airway pressure use per week (upper graph) and percentage of days the treatment was used per week (lower graph) over the 3 mo of treatment in the three groups. Dashed line, usual care; solid line, usual care with Web access to PAP data; dash-dot line, usual care with Web access to PAP data and a first-week financial incentive (FI).