
Figure 2.
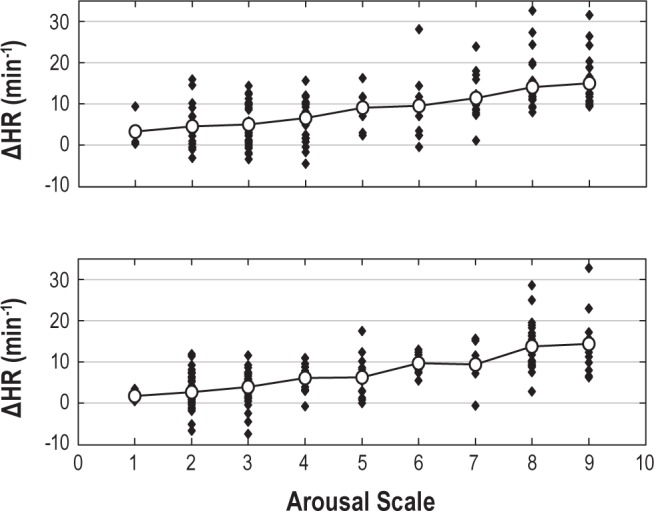
The change in heart rate (ΔHR) with arousals of different intensities in a representative subject. Top panel shows the HR response to arousal for recording made on day 1 and the bottom panel shows the HR response to arousal for recording made on day 2. Each solid dot is one or more arousals and the solid line shows the average HR response at each scale. The equations of best fitted regression lines to the average HR responses for 2 days are: Day 1: y = 1.5 × +1.1; r = 0.99; Day 2: y = 1.6 × −0.6, r = 0.98.