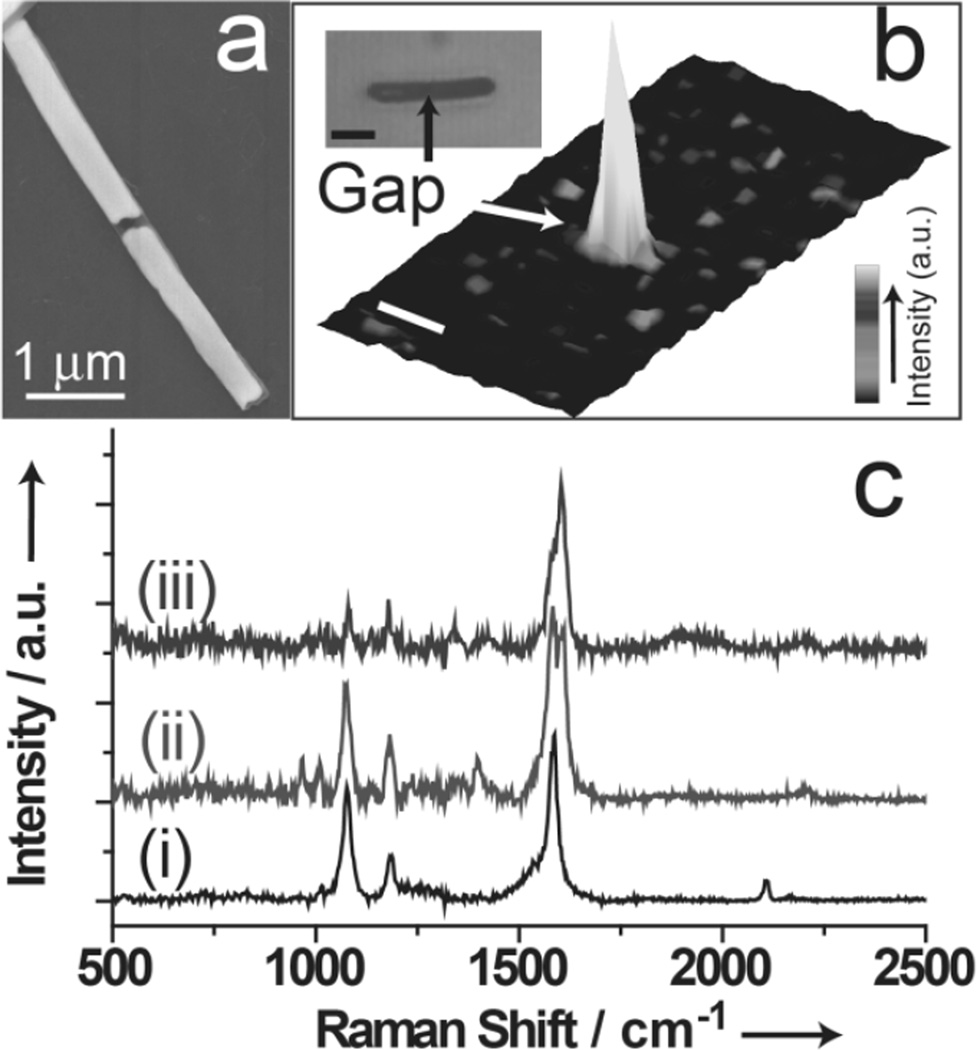
Figure 3.
(a) SEM image of an OWL generated nanowire with a 100 nm nanogap. (b) 3D confocal scanning Raman images of an OWL generated gap structure modified with 1. Optical image (inset of b), which is simultaneously obtained, shows the position of the nanogap. Scale bar 2 µm. (c) Representative Raman spectrum taken for the different steps. (i) 1 modified within gap; (ii) following addtion of 2; and (iii) following addtion of 3.

