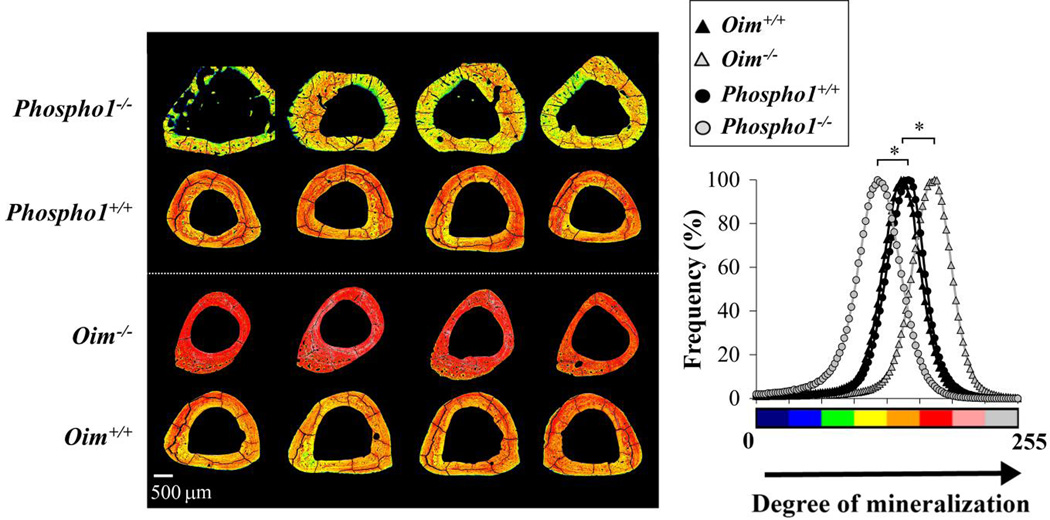
Figure 10.
Normalized backscattered electron intensity maps of tibial cross sections (left) and the combined histograms of pixel values for each strain (right) from non-mineralized (0, black) to high mineralization (255, white). Bone matrix was hypomineralized in Phospho1 −/− and hypermineralized in oim−/−, as calculated from the mean grey values of the histograms. * p<0.001.

