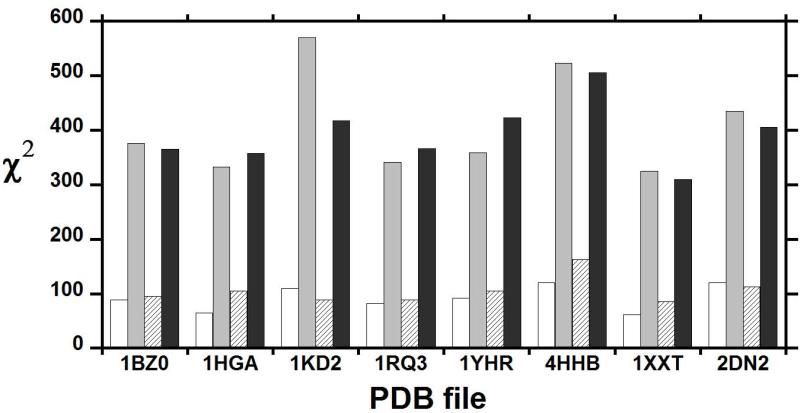
Figure 5.
The fitting quality of experimentally determined RDCs versus those calculated from X-ray crystal structures of deoxy-Hb A. The PDB code of each X-ray crystal structure is shown along the x axis, and the corresponding reduced χ2 values of the fit to either the α1β1 dimer (blank in the absence and grey in the presence of IHP) or the whole tetramer (striped in the absence and black in the presence of IHP) are along the y axis. Adapted with permission from ref. 72. Copyright 2007 American Chemical Society.

