Figure 6.
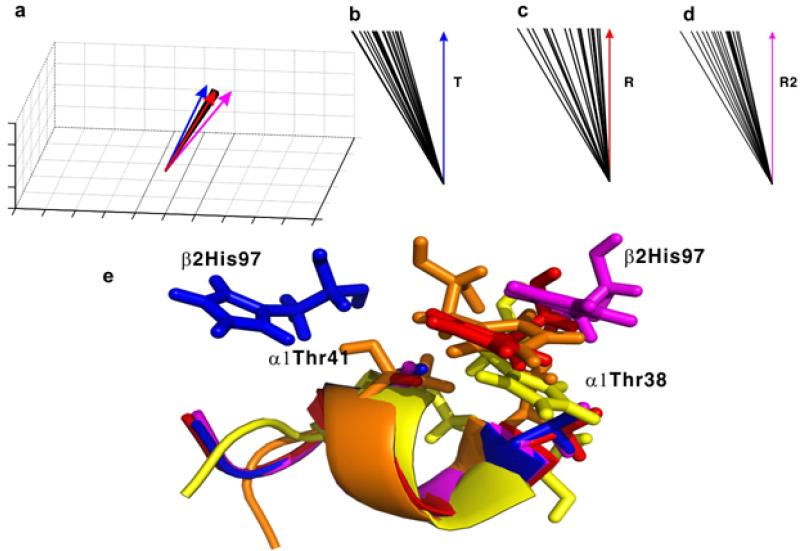
Comparison of the symmetric axis orientations (a–d) and the switch region in the α1β2 interface (e) of the 20 lowest-energy solution conformations of HbCO A with those of the T, R, and R2 crystal structures. Panel (a) shows the distribution of the C2 axes of different structures in a three-dimensional frame. Angles between the average of the 20 lowest-energy NMR structures (represented with green arrows) and the C2 axes of the T, R, and R2 structures are shown in panels (b), (c) and (d), respectively. The angles shown in panels b–d are drawn off scale and enlarged for better visualization. The C2 axes of the T, the R, the R2, and the 20 solution conformations in panel (a) are shown as blue, red, magenta, and black lines, respectively. The switch regions in the T, R, R2, and one representative solution conformation are colored blue, red, magenta, and yellow, respectively, in panel (e). The backbone atoms of residues 38-44 in the α1 subunit are superimposed to illustrate the relative orientation of β297His. Reprinted with permission from ref. 74. Copyright 2013 American Chemical Society.

