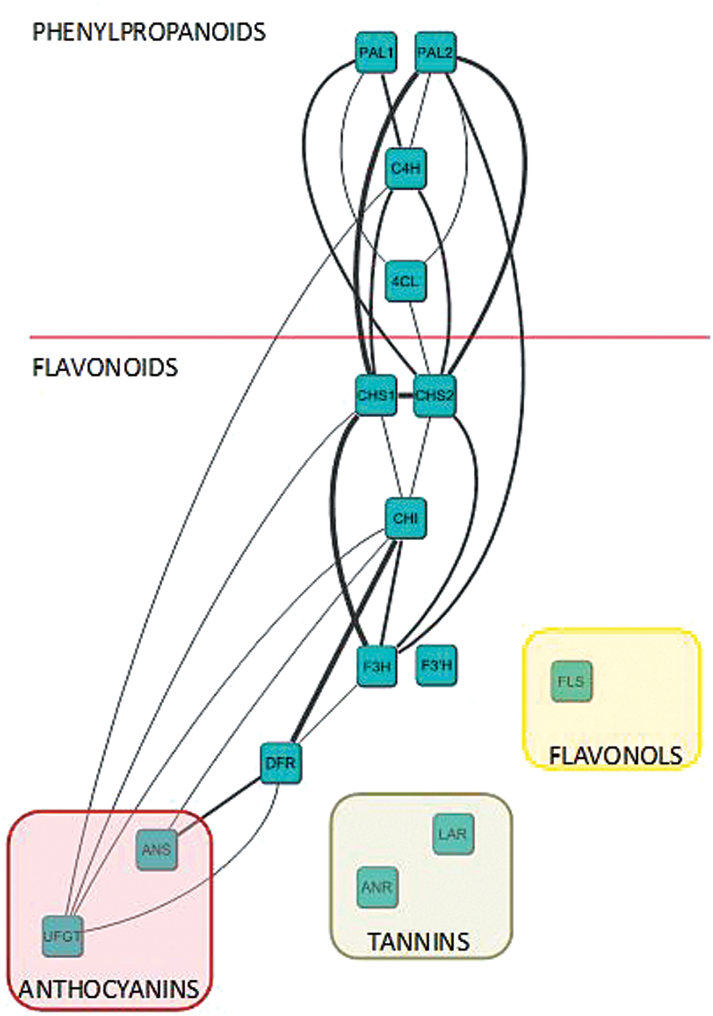
Fig. 2.
Expression profile correlation analysis of the flavonoid biosynthetic pathway in the ‘Mara des Bois’ × ‘Elyana’ F1 population. Correlations are considered positive when Pearson’s r>0.65 (P<0.05). The thicker the line the more close to 1 the correlation is. PAL, phenylalanine ammonia lyase; C4H, cinnamate-4-hydroxylase; 4CL, 4-coumaroyl:CoA-ligase; CHS, chalcone synthase; CHI, chalcone isomerase; F3H, flavanone 3 hydrolase; F3’H, flavanone 3’ hydrolase; FLS, flavonol synthase; DFR, dihydroflavanol reductase; LAR, leucoanthocyanidin reductase; ANR, anthocyanidin reductase; ANS, anthocyanidin synthase; UFGT, UDP-glucose flavonoid glycosyl transferase.

