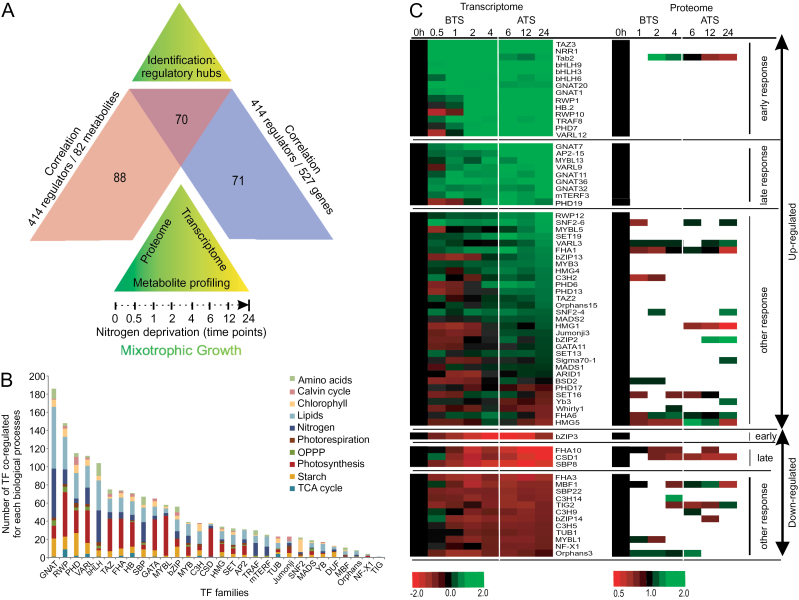
Fig. 1.
Establishment of correlation networks for identification of transcriptional regulatory candidates. (A) Overview of the experimental design used to identify the correlation regulatory networks in Chlamydomonas reinhardtii cw15 grown under N deprivation stress and sampled using different ‘omic’ datasets obtained at multiple time points. (B) Distribution of TF and TR family members that displayed correlations with genes involved in different biological processes and that were differentially expressed in Chlamydomonas during N deprivation. Y-axis values indicate the number of genes from each TF and TR family (indicated on the X-axis) that were highly correlated from different biological processes, indicated by colour. Only those correlations that in absolute value were not smaller than 0.9 were used to generate this figure. See Supplementary Table S3 for details of the specific genes used to generate this graph. (C) Transcriptomic and proteomic profiling of the 70 TFs/TRs that were common to the two sets of correlation analysis, TFs/TRs versus metabolites and TFs/TRs versus genes. Heat maps show the expression level of transcripts and the accumulation of proteins for each identified TF/TR during the N deprivation time course. The transcript expression levels are presented as log base-2 fold change relative to time zero. The protein accumulation values are presented as a ratio relative to 1. The data are classified in two groups: ‘up-regulated’ (green) and ‘down-regulated’ (red). Each group was sub-classified into three sub-groups: ‘early response’, ‘late response’ and ‘unaltered’ based on pattern of expression relative to the onset of the accumulation of TAG. BTS (Before TAG Synthesis) corresponds to the time period 0.5–4h for early responses and ATS (After TAG Synthesis initiation) corresponds to 6–24h for later responses.

