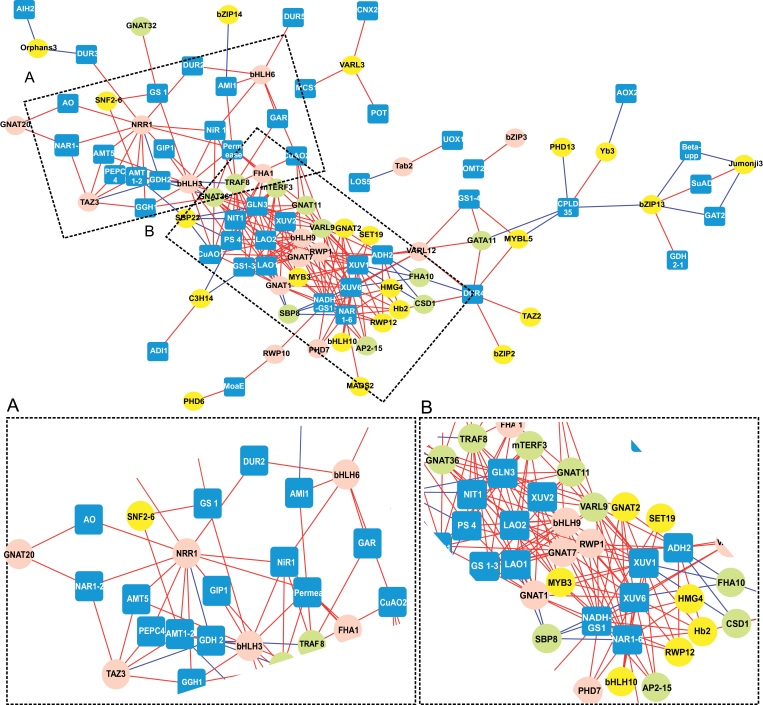
Fig. 2.
Visualization of the nitrogen metabolism regulatory network in Chlamydomonas during N deprivation that included 67 metabolism-related genes and the 70 TFs/TRs that were differentially expressed. Inset (A): The subnetwork that included TF/TR genes that showed the highest correlations during the early phase (1–4h) with genes involved in the assimilation and transport of inorganic N. Inset (B): The subnetwork that included TF/TR genes that were highly correlated during the later phase (6–24h) with genes required for assimilation of organic N. Nodes: TFs/TRs are represented by pink circles (for the early responders), green circles (for late responders) and yellow circles (for those with a different response). Metabolism-related genes are represented by blue squares. Lines connecting two nodes represent significant correlations: red represents a positive correlation and blue represents a negative correlation. See Supplementary Table S3 for details on genes included in this analysis.

