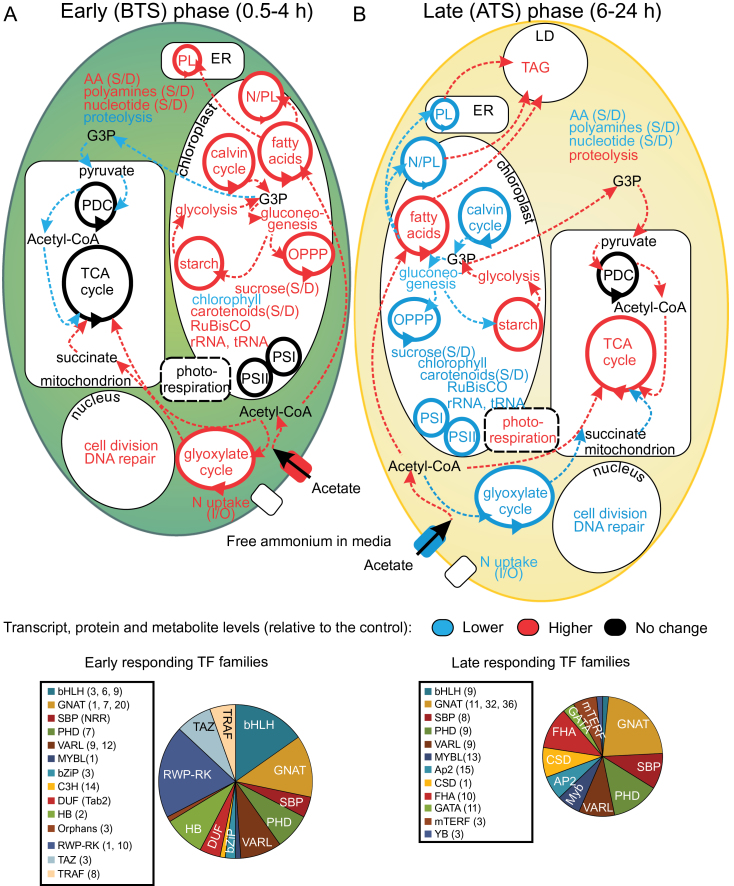
Fig. 4.
Model of how Chlamydomonas responds to N deprivation (A) during the BTS phase (0.5–4h) and (B) ATS phase (6–24h). Pathways highlighted in red contain genes, proteins and metabolites significantly up-regulated; those in blue contain genes, proteins and metabolites significantly down-regulated; and those in black do not display significant change. Abbreviations: S/D, ratio of synthesis/degradation; I/O, ratio of inorganic/organic N; LD, lipid droplets; PL, polar lipids; N/PL, non- and polar lipids; ER, endoplasmic reticulum; PDC, pyruvate dehydrogenase complex; PSI, photosystem I; PSII, photosystem II. The association of putative transcription factors (TFs) with each state is depicted in pie charts; sizes are proportional to the total number of correlations detected. TFs that were significantly enriched under those conditions are listed in two boxes, with abbreviations defined in the text or in Supplementary Dataset S1.

