Fig. 1.
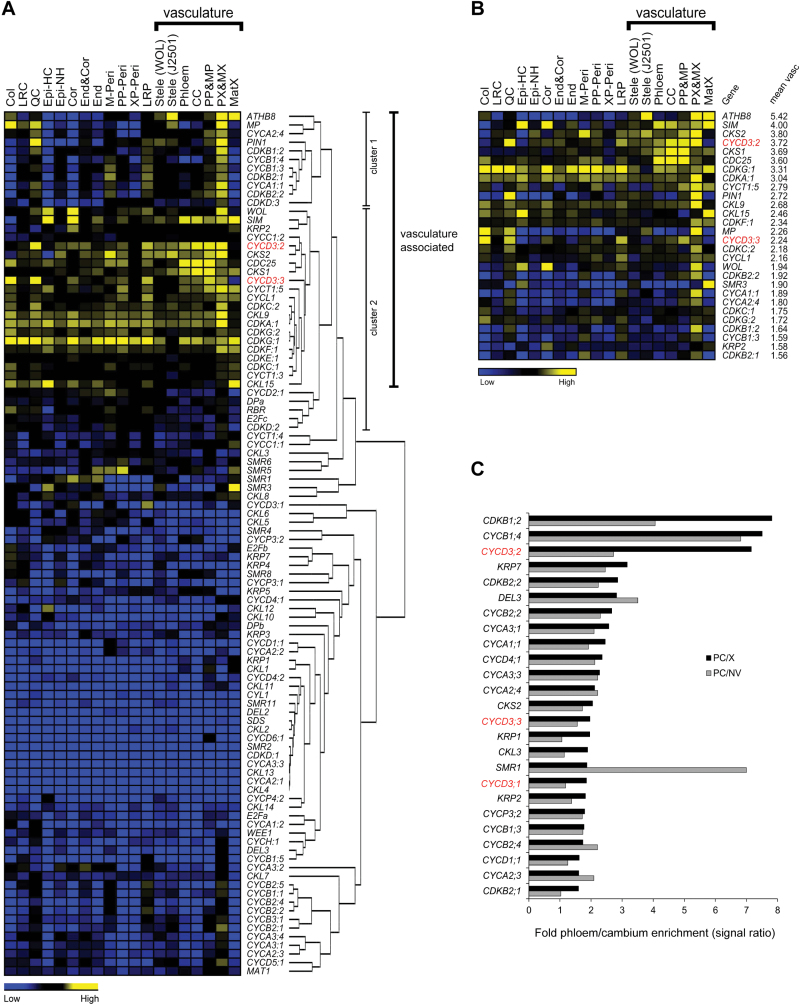
Expression patterns and clustering analysis of core cell-cycle genes in specific cell and tissue types of the root and mature hypocotyl. (A) Heat map representation of hierarchical clustering of 96 core cell-cycle genes and four cambium marker genes based on expression profile data across 19 different cell and tissue types of the root tip (Brady et al., 2007). The solid bar indicates the seven cell and tissue types comprising the vasculature. High and low levels of expression are indicated by yellow and blue, respectively. The expression levels shown are relative to zero based on global normalization method (Brady et al., 2007). Two distinct clusters of co-regulated genes showing broadly ‘vasculature-associated’ expression are indicated (cluster 1 and cluster 2). Cell and tissue types from left to right are columella (Col), lateral root cap (LRC), quiescent centre (QC), epidermis hair cell (Epi-HC), epidermis non-hair cell (Epi-NH), cortex (Cor), endodermis and cortex (End&Cor), endodermis (End), mature pericycle (M-Peri), phloem pole pericycle (PP-Peri), xylem pole pericycle (XP-Peri), lateral root primordia initials (LRP), stele using WOL marker [Stele (WOL)], stele using J2501 marker [Stele (J2501)], phloem and companion cell (Phloem), companion cell (CC), protophloem and metaphloem (PP&MP), protoxylem and metaxylem (PX&MX), mature xylem (MatX). (B) Ranking of 96 core cell-cycle genes and four cambium marker genes according to their average expression level across the seven cell and tissue types comprising the vasculature (indicated by the solid bar), based on expression profile data of the root tip (Brady et al., 2007). Only the top 28 highest vasculature-expressed genes are shown and are displayed with their corresponding expression patterns across the root. Abbreviations used are as shown in (A). (C) Ranking of core cell-cycle genes according to their degree of phloem/cambium (PC) enrichment calculated as fold-differences between mean array signal intensities in PC versus xylem (X) tissue (PC/X), and in PC versus non-vascular (NV) tissues (PC/NV), using microarray data from the mature hypocotyl (Zhao et al., 2005). Only the top 25 highest PC-enriched genes are shown.

