Fig. 2.
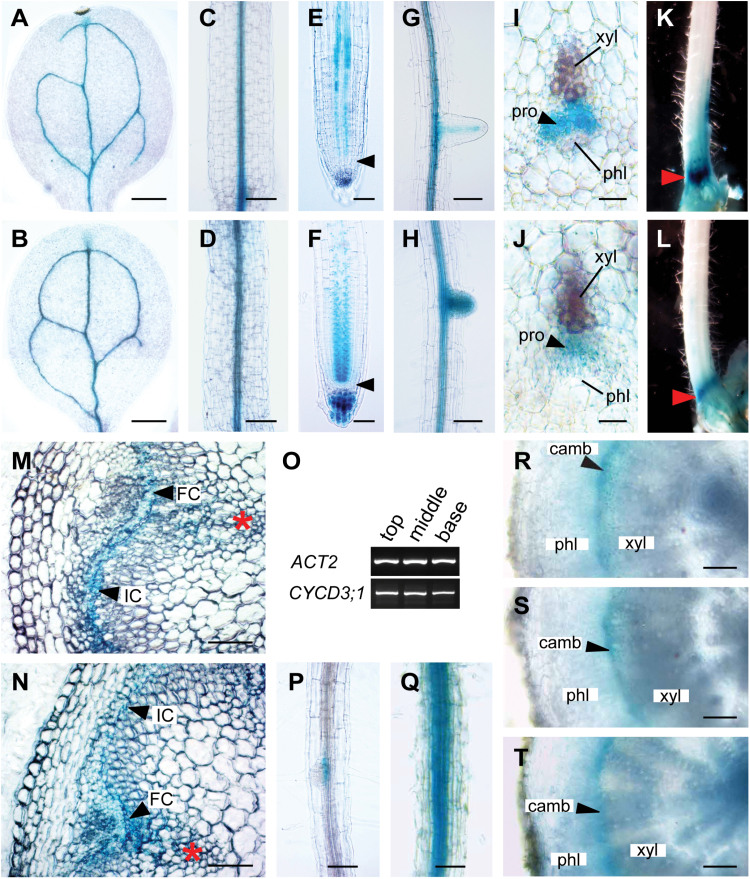
CYCD3 genes are specifically expressed in the procambium and cambium during vascular development. (A–H) Images of 7-d-old seedlings showing pCYCD3;2:GUS (A, C, E, G) and pCYCD3;3:GUS (B, D, F, H) activity in the vasculature of the cotyledon (A, B), hypocotyl (C, D), root tip (E, F), and mature root zone and lateral root (G, H). In (E) and (F), the root apical meristem is indicated by arrowheads. (I, J) Transverse sections at 5mm below the shoot apex of 30-cm-long inflorescences showing pCYCD3;2:GUS (I) and pCYCD3;3:GUS (J) activity restricted to the procambium. (K, L) pCYCD3;2:GUS (K) and pCYCD3;3:GUS (L) staining accumulates at the base of 30-cm-long inflorescences (indicated by arrowheads) corresponding to the zone of maximum IC initiation and secondary growth. (M, N) Transverse sections at the base of 30-cm-long inflorescences immediately above the rosette reveal pCYCD3;2:GUS (M) and pCYCD3;3:GUS (N) activity restricted to fascicular cambium (FC) and interfascicular cambium (IC) (indicated by arrowheads). Asterisks indicate primary vascular bundles. (O) RT-PCR analysis reveal CYCD3;1 transcripts at the top, middle, and base of 30-cm-long inflorescences (ACT2 was used as endogenous control). (P, Q) pCYCD3;1:GUS expression was detected in root vascular tissue in 7-d-old seedlings (P), and in mature roots in 30-cm-tall plants (Q). (R-T) Transverse sections at the hypocotyl base from 30-cm-tall plants reveal pCYCD3;1:GUS (R), pCYCD3;2:GUS (S), and pCYCD3;3:GUS (T) expression restricted to the cambium. camb, cambium; FC, fascicular cambium; IC, interfascicular cambium; phl, phloem; pro, procambium; xyl, xylem. Scale bars=250 μm (A, B), 100 μm (C, D, G, H, M, N, P, Q, R, S, T), 50 μm (E, F), 25 μm (I, J).

