Fig. 4.
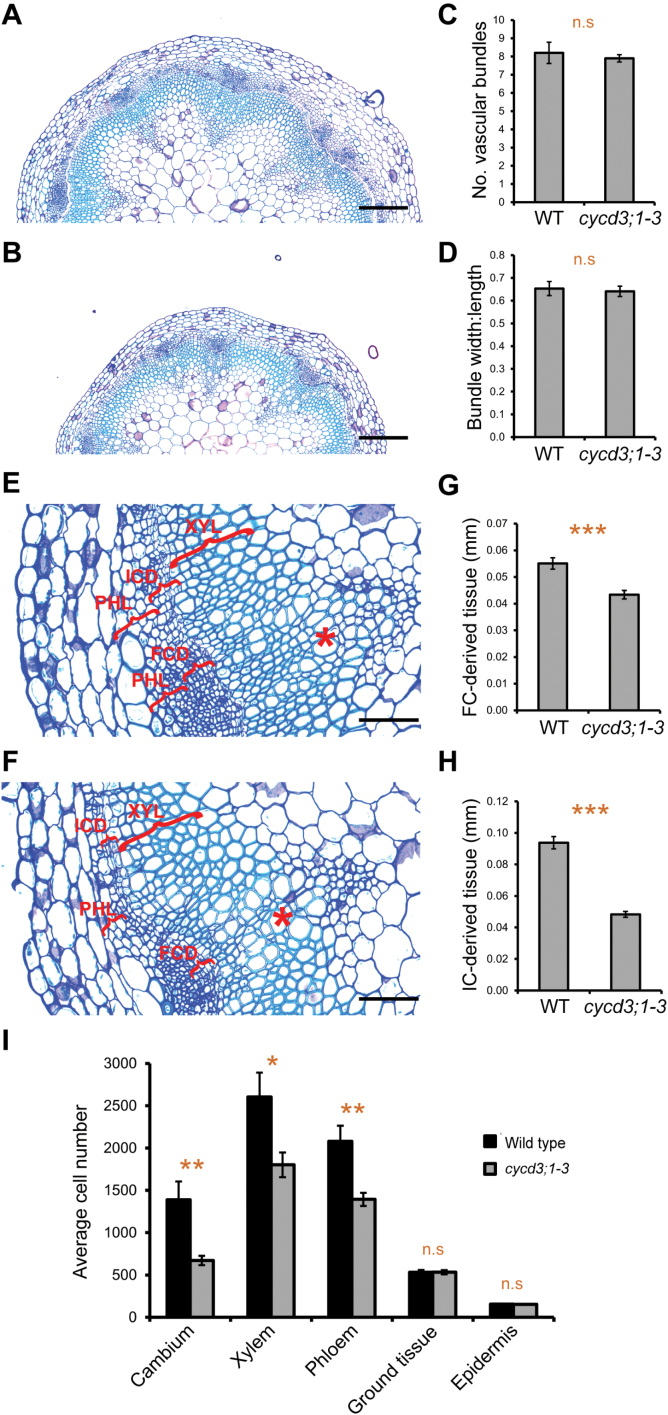
Loss of CYCD3 leads to reduced cambial activity and vascular cell number in the inflorescence stem. (A, B) Histological representations at the base of 30-cm-long inflorescences immediately above the rosette showing tissue organization in wild-type (A) and cycd3;1–3 (B) plants. (C) Measurement of vascular bundle number at the base of wild-type and cycd3;1–3 stems. Error bars represent standard error. Student’s t test showed that wild type and cycd3;1–3 were not significantly different (n=5). n.s, not statistically significant. (D) Measurement of the width:length (tangential:radial) ratio of vascular bundles at the base of wild-type and cycd3;1–3 stems. Error bars represent standard error. Student’s t test showed that wild type and cycd3;1–3 were not significantly different (n=15). n.s, not statistically significant. (E, F) Higher magnification histological representations of vascular tissue at the base of wild-type (E) and cycd3;1–3 (F) stems. The lateral extension of the FC-derived (FCD) and IC-derived (ICD) tissue, and of the phloem (PHL) and xylem (XYL) tissues are indicated by red brackets. Asterisks indicate primary vascular bundles. (G, H) Measurement of lateral extension of the FCD (G) and ICD (H) tissues at the base of wild-type and cycd3;1–3 stems. Error bars represent standard error. Student’s t tests showed that the differences between wild type and cycd3;1–3 in both the FCD (G) and ICD (H) tissues were extremely statistically significant (P <0.001; n=15) indicated by triple asterisks. (I) Quantification of average cell number of different cell types in tissue sections at the base of wild-type and cycd3;1–3 stems. Error bars represent standard error. Significance levels are shown as the difference between wild type and cycd3;1–3 with P <0.05 and P <0.01 indicated by single and double asterisks, respectively (n=15). n.s, not statistically significant. Scale bars=200 μm (A, B), 100 μm (E, F).

