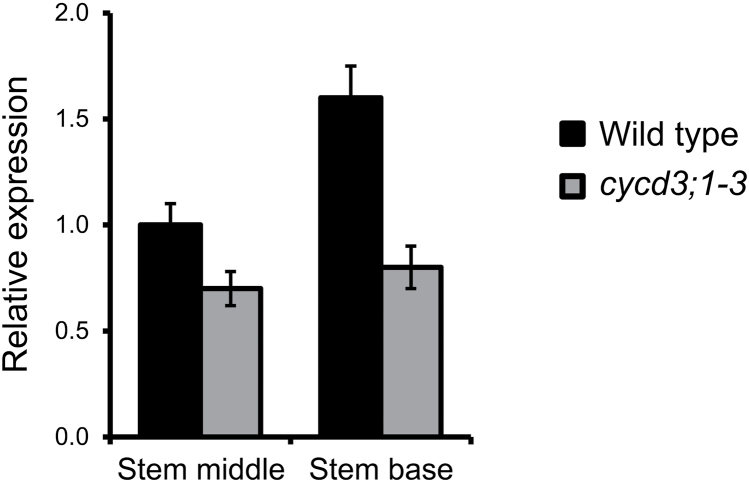
Fig. 5.
Expression analysis of the CYCB1;1 mitotic marker gene in the inflorescence stem. Reverse transcription quantitative PCR was used to assay CYCB1;1 transcript abundance in the middle and base of 30-cm-long stems of wild-type and cycd3;1–3 plants using ACTIN2 as the endogenous reference gene. Relative transcript abundance is scaled to expression in the middle stem of the wild type. Error bars represent standard error.

