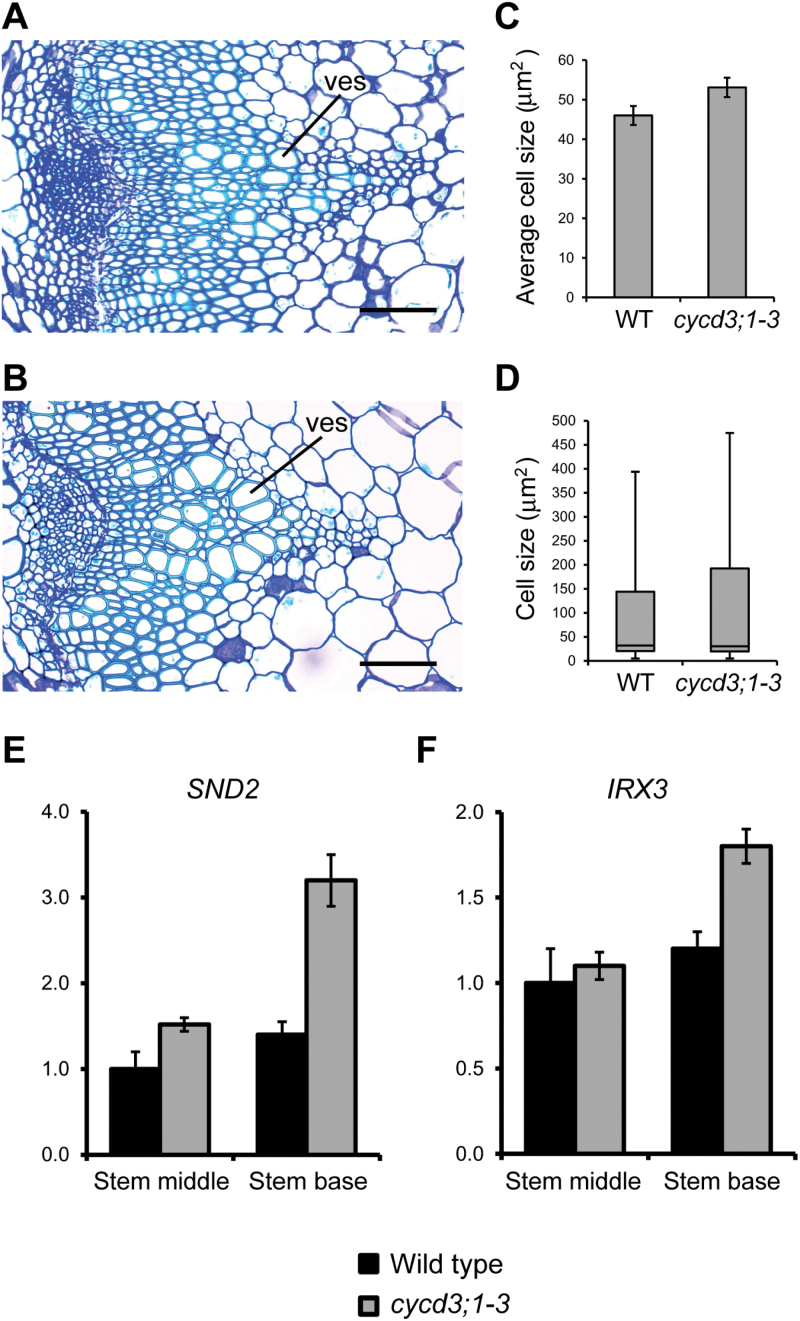
Fig. 6.
Loss of CYCD3 leads to increased xylem cell size and differentiation in the inflorescence stem. (A, B) High magnification histological representations at the base of 30-cm-long inflorescences showing xylem cells in primary and secondary vascular tissue in wild-type (A) and cycd3;1–3 (B) plants. (C) Measurement of xylem cell size at the base of 30-cm-tall wild-type and cycd3;1–3 plants showing the increased average cell size in cycd3;1–3. Error bars represent standard error. Student’s t test showed that the difference between the wild type and cycd3;1–3 was statistically significant (P <0.05; n >2000). (D) Box plot representation of xylem cell size at the base of 30-cm-tall plants showing the distribution of xylem cell sizes in wild-type and cycd3;1–3 stems. Displayed are the maximum and minimum values, median, and 30th and 95th percentiles. Error bars represent standard error. (E, F) Expression analysis of the xylem cell differentiation marker genes SND2 (E) and IRX3 (F) in the middle and base of 30-cm-long stems of wild-type and cycd3;1–3 plants by RT-qPCR. Transcript abundance was normalized using ACTIN2 as the endogenous reference gene. Relative transcript abundance is scaled to expression in the middle stem of the wild type. Error bars represent standard error. ves, xylem vessels. Scale bars=100 μm (A, B).

