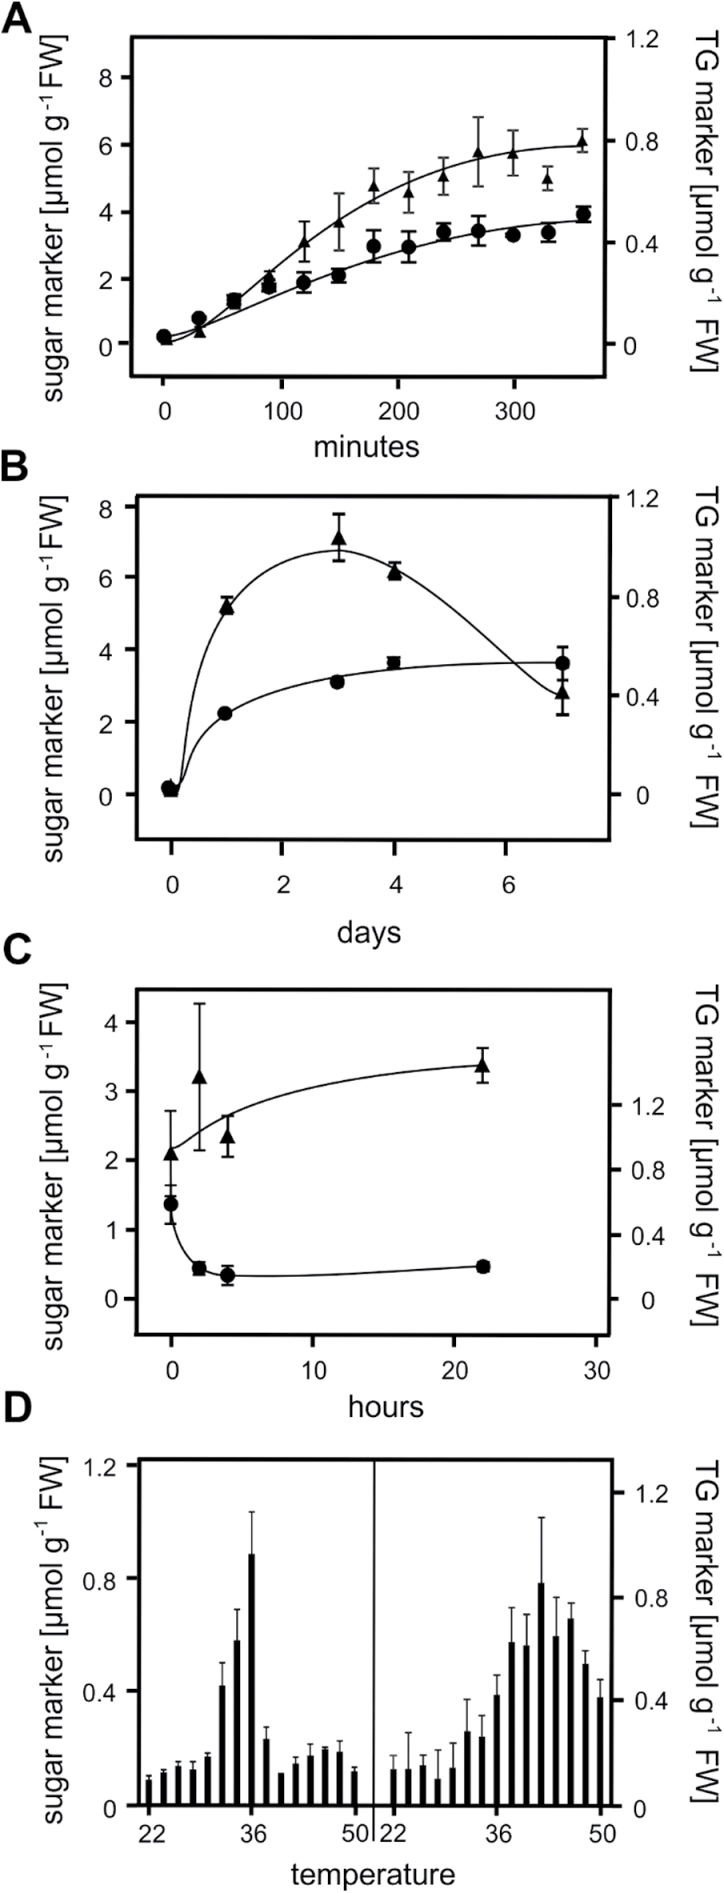
Fig. 3.
Time- and temperature-dependent responses of sugar (▲) and TG (●) markers in Arabidopsis seedlings. Seedlings exposed to 37°C for the times indicated were analysed (A and B). Heat-acclimated seedlings (37°C, 2h) were transferred back to the growth condition (22°C) for the times indicated (C). Sugar and TG markers were determined in seedlings treated at different temperatures (22°C to 50°C) for 2h (D). Data represent means ± SD, n = 4.

