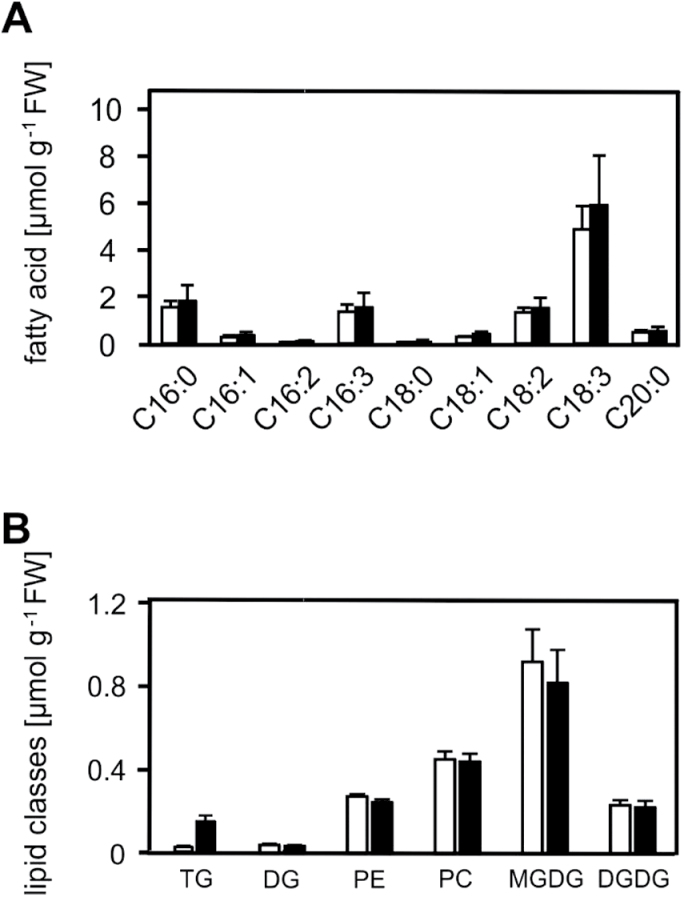
Fig. 8.
Levels of total fatty acids, neutral lipids, and membrane lipids after heat acclimation. Total fatty acids (A), TG markers and complex lipids (B) from control (22°C; white columns) and heat-acclimated (37°C, 2h; black columns) seedlings. Data represent means ± SD, n = 4 for the determination of total fatty acids, and n = 9 for the determination of complex lipids.

