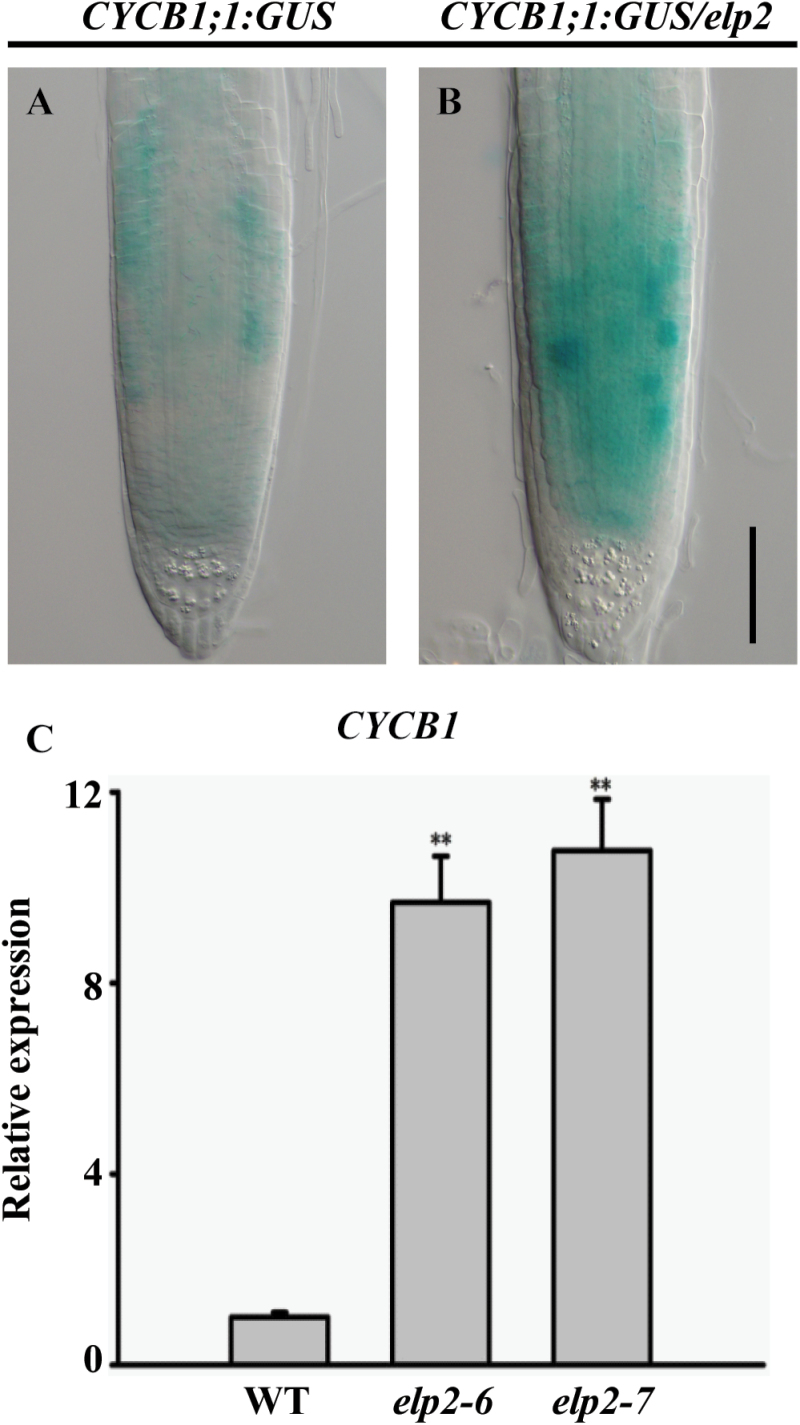
Fig. 5.
CYCB1 expression is increased in the elp2 mutant. (A, B) Expression of the CYCB1;1:GUS transgene, (C) transcription of CYCB1 assayed by qRT-PCR. The data represent mean values with their associated SD, (n=3); **, P<0.001. Bars, 50 µm (A, B). (This figure is available in colour at JXB online.)

